Bahamian vs Bermudan Bachelor's Degree
COMPARE
Bahamian
Bermudan
Bachelor's Degree
Bachelor's Degree Comparison
Bahamians
Bermudans
32.5%
BACHELOR'S DEGREE
0.3/ 100
METRIC RATING
265th/ 347
METRIC RANK
38.0%
BACHELOR'S DEGREE
54.2/ 100
METRIC RATING
171st/ 347
METRIC RANK
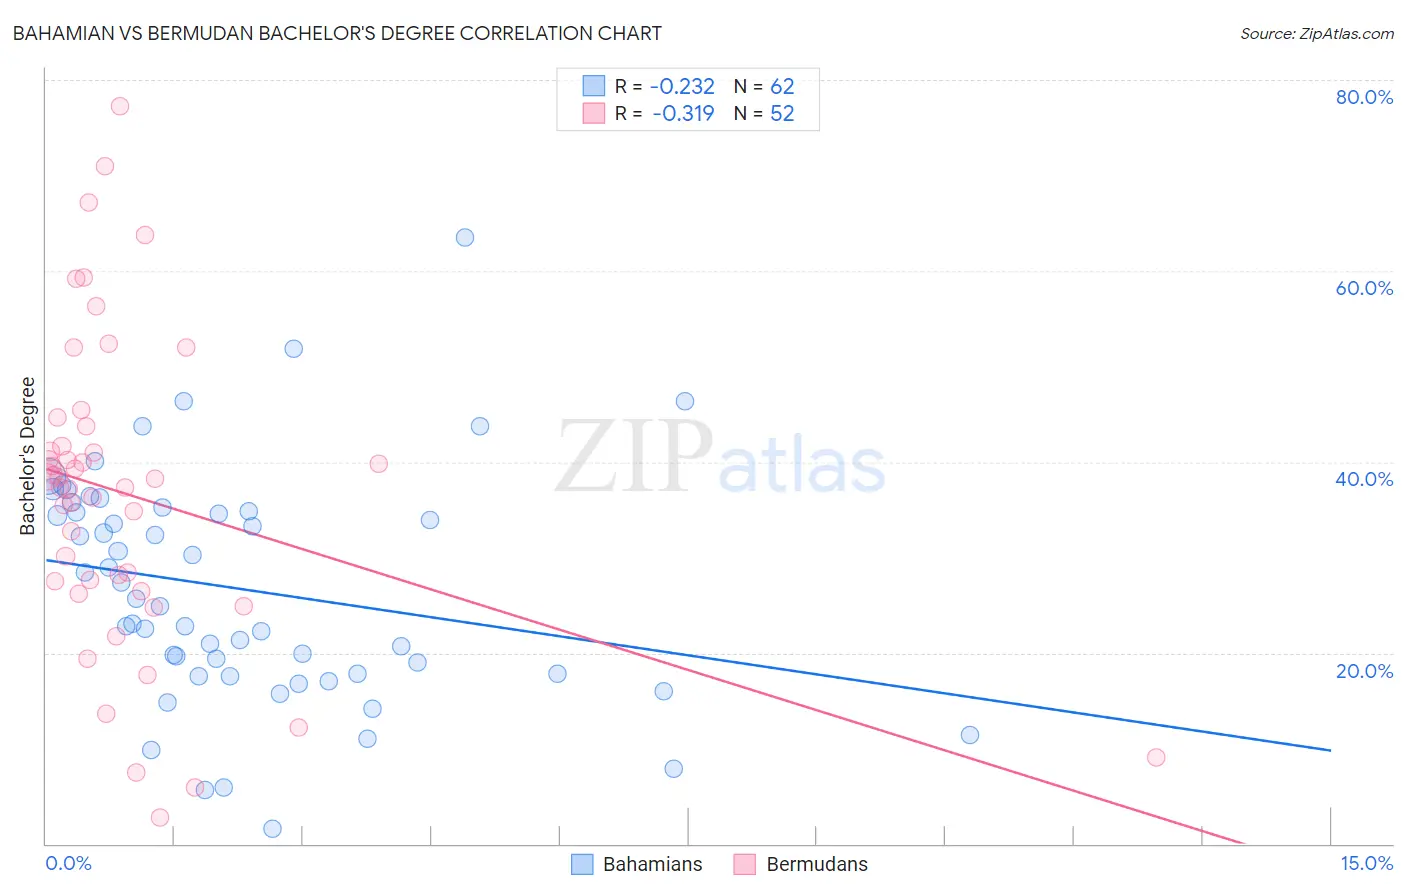
Bahamian vs Bermudan Bachelor's Degree Correlation Chart
The statistical analysis conducted on geographies consisting of 112,698,493 people shows a weak negative correlation between the proportion of Bahamians and percentage of population with at least bachelor's degree education in the United States with a correlation coefficient (R) of -0.232 and weighted average of 32.5%. Similarly, the statistical analysis conducted on geographies consisting of 55,732,325 people shows a mild negative correlation between the proportion of Bermudans and percentage of population with at least bachelor's degree education in the United States with a correlation coefficient (R) of -0.319 and weighted average of 38.0%, a difference of 16.7%.
Bachelor's Degree Correlation Summary
| Measurement | Bahamian | Bermudan |
| Minimum | 1.5% | 2.7% |
| Maximum | 63.5% | 77.3% |
| Range | 61.9% | 74.5% |
| Mean | 26.7% | 36.6% |
| Median | 25.3% | 37.7% |
| Interquartile 25% (IQ1) | 17.8% | 27.0% |
| Interquartile 75% (IQ3) | 34.8% | 42.7% |
| Interquartile Range (IQR) | 17.0% | 15.7% |
| Standard Deviation (Sample) | 12.1% | 16.3% |
| Standard Deviation (Population) | 12.0% | 16.1% |
Similar Demographics by Bachelor's Degree
Demographics Similar to Bahamians by Bachelor's Degree
In terms of bachelor's degree, the demographic groups most similar to Bahamians are Central American Indian (32.5%, a difference of 0.030%), Immigrants from Dominica (32.5%, a difference of 0.030%), Cuban (32.5%, a difference of 0.15%), Belizean (32.8%, a difference of 0.81%), and Immigrants from Portugal (32.2%, a difference of 0.91%).
| Demographics | Rating | Rank | Bachelor's Degree |
| French American Indians | 0.6 /100 | #258 | Tragic 33.1% |
| Osage | 0.5 /100 | #259 | Tragic 33.0% |
| Malaysians | 0.5 /100 | #260 | Tragic 32.9% |
| Africans | 0.5 /100 | #261 | Tragic 32.9% |
| Immigrants | Jamaica | 0.5 /100 | #262 | Tragic 32.9% |
| Belizeans | 0.4 /100 | #263 | Tragic 32.8% |
| Central American Indians | 0.3 /100 | #264 | Tragic 32.5% |
| Bahamians | 0.3 /100 | #265 | Tragic 32.5% |
| Immigrants | Dominica | 0.3 /100 | #266 | Tragic 32.5% |
| Cubans | 0.3 /100 | #267 | Tragic 32.5% |
| Immigrants | Portugal | 0.2 /100 | #268 | Tragic 32.2% |
| Immigrants | Belize | 0.2 /100 | #269 | Tragic 32.1% |
| Immigrants | Nicaragua | 0.2 /100 | #270 | Tragic 31.9% |
| Central Americans | 0.2 /100 | #271 | Tragic 31.9% |
| Comanche | 0.2 /100 | #272 | Tragic 31.9% |
Demographics Similar to Bermudans by Bachelor's Degree
In terms of bachelor's degree, the demographic groups most similar to Bermudans are Czech (38.0%, a difference of 0.010%), Ghanaian (38.0%, a difference of 0.11%), Immigrants from Somalia (37.9%, a difference of 0.14%), Immigrants from Iraq (37.9%, a difference of 0.16%), and Danish (38.1%, a difference of 0.20%).
| Demographics | Rating | Rank | Bachelor's Degree |
| Hungarians | 62.1 /100 | #164 | Good 38.3% |
| Sri Lankans | 59.1 /100 | #165 | Average 38.2% |
| Somalis | 58.6 /100 | #166 | Average 38.1% |
| Scottish | 56.6 /100 | #167 | Average 38.1% |
| Danes | 56.2 /100 | #168 | Average 38.1% |
| Ghanaians | 55.3 /100 | #169 | Average 38.0% |
| Czechs | 54.4 /100 | #170 | Average 38.0% |
| Bermudans | 54.2 /100 | #171 | Average 38.0% |
| Immigrants | Somalia | 52.8 /100 | #172 | Average 37.9% |
| Immigrants | Iraq | 52.5 /100 | #173 | Average 37.9% |
| Immigrants | Bangladesh | 50.0 /100 | #174 | Average 37.8% |
| Immigrants | Uruguay | 48.3 /100 | #175 | Average 37.8% |
| Costa Ricans | 47.6 /100 | #176 | Average 37.7% |
| Basques | 47.4 /100 | #177 | Average 37.7% |
| Immigrants | Cameroon | 46.8 /100 | #178 | Average 37.7% |