Immigrants from Nigeria vs Bermudan Bachelor's Degree
COMPARE
Immigrants from Nigeria
Bermudan
Bachelor's Degree
Bachelor's Degree Comparison
Immigrants from Nigeria
Bermudans
36.7%
BACHELOR'S DEGREE
23.1/ 100
METRIC RATING
203rd/ 347
METRIC RANK
38.0%
BACHELOR'S DEGREE
54.2/ 100
METRIC RATING
171st/ 347
METRIC RANK
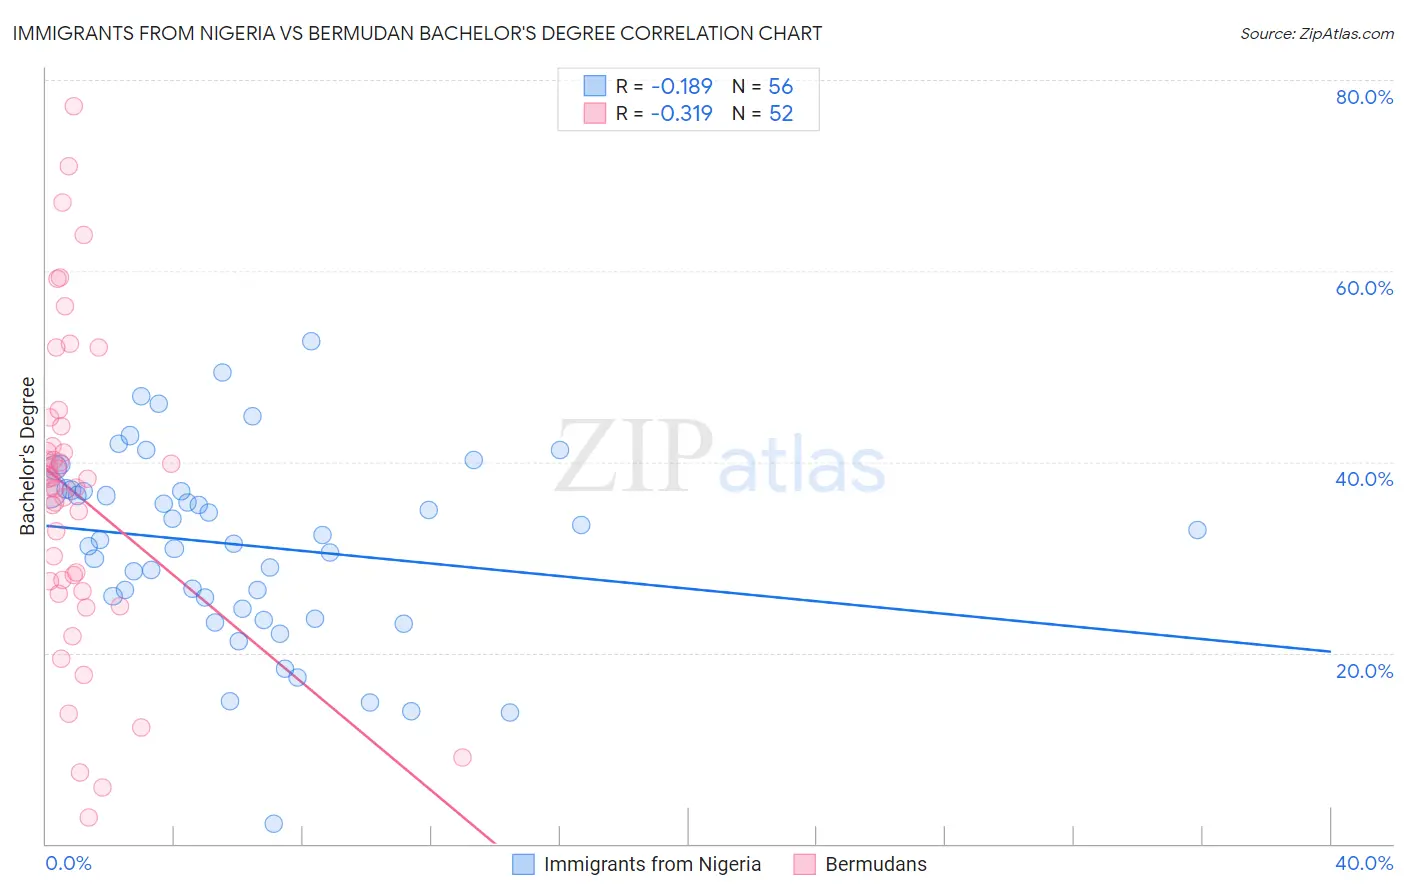
Immigrants from Nigeria vs Bermudan Bachelor's Degree Correlation Chart
The statistical analysis conducted on geographies consisting of 283,462,010 people shows a poor negative correlation between the proportion of Immigrants from Nigeria and percentage of population with at least bachelor's degree education in the United States with a correlation coefficient (R) of -0.189 and weighted average of 36.7%. Similarly, the statistical analysis conducted on geographies consisting of 55,732,325 people shows a mild negative correlation between the proportion of Bermudans and percentage of population with at least bachelor's degree education in the United States with a correlation coefficient (R) of -0.319 and weighted average of 38.0%, a difference of 3.4%.
Bachelor's Degree Correlation Summary
| Measurement | Immigrants from Nigeria | Bermudan |
| Minimum | 2.0% | 2.7% |
| Maximum | 52.6% | 77.3% |
| Range | 50.6% | 74.5% |
| Mean | 31.3% | 36.6% |
| Median | 32.1% | 37.7% |
| Interquartile 25% (IQ1) | 25.2% | 27.0% |
| Interquartile 75% (IQ3) | 37.0% | 42.7% |
| Interquartile Range (IQR) | 11.8% | 15.7% |
| Standard Deviation (Sample) | 9.9% | 16.3% |
| Standard Deviation (Population) | 9.8% | 16.1% |
Similar Demographics by Bachelor's Degree
Demographics Similar to Immigrants from Nigeria by Bachelor's Degree
In terms of bachelor's degree, the demographic groups most similar to Immigrants from Nigeria are Immigrants (36.7%, a difference of 0.040%), Finnish (36.7%, a difference of 0.14%), Spaniard (36.6%, a difference of 0.28%), Immigrants from Zaire (36.8%, a difference of 0.29%), and Immigrants from South Eastern Asia (36.8%, a difference of 0.31%).
| Demographics | Rating | Rank | Bachelor's Degree |
| Celtics | 29.5 /100 | #196 | Fair 37.0% |
| Czechoslovakians | 29.2 /100 | #197 | Fair 37.0% |
| Welsh | 29.1 /100 | #198 | Fair 37.0% |
| Immigrants | Costa Rica | 27.4 /100 | #199 | Fair 36.9% |
| Immigrants | Ghana | 27.4 /100 | #200 | Fair 36.9% |
| Immigrants | South Eastern Asia | 25.4 /100 | #201 | Fair 36.8% |
| Immigrants | Zaire | 25.3 /100 | #202 | Fair 36.8% |
| Immigrants | Nigeria | 23.1 /100 | #203 | Fair 36.7% |
| Immigrants | Immigrants | 22.8 /100 | #204 | Fair 36.7% |
| Finns | 22.2 /100 | #205 | Fair 36.7% |
| Spaniards | 21.2 /100 | #206 | Fair 36.6% |
| Immigrants | Middle Africa | 20.6 /100 | #207 | Fair 36.6% |
| Immigrants | Thailand | 19.4 /100 | #208 | Poor 36.5% |
| Panamanians | 18.8 /100 | #209 | Poor 36.5% |
| French | 18.6 /100 | #210 | Poor 36.5% |
Demographics Similar to Bermudans by Bachelor's Degree
In terms of bachelor's degree, the demographic groups most similar to Bermudans are Czech (38.0%, a difference of 0.010%), Ghanaian (38.0%, a difference of 0.11%), Immigrants from Somalia (37.9%, a difference of 0.14%), Immigrants from Iraq (37.9%, a difference of 0.16%), and Danish (38.1%, a difference of 0.20%).
| Demographics | Rating | Rank | Bachelor's Degree |
| Hungarians | 62.1 /100 | #164 | Good 38.3% |
| Sri Lankans | 59.1 /100 | #165 | Average 38.2% |
| Somalis | 58.6 /100 | #166 | Average 38.1% |
| Scottish | 56.6 /100 | #167 | Average 38.1% |
| Danes | 56.2 /100 | #168 | Average 38.1% |
| Ghanaians | 55.3 /100 | #169 | Average 38.0% |
| Czechs | 54.4 /100 | #170 | Average 38.0% |
| Bermudans | 54.2 /100 | #171 | Average 38.0% |
| Immigrants | Somalia | 52.8 /100 | #172 | Average 37.9% |
| Immigrants | Iraq | 52.5 /100 | #173 | Average 37.9% |
| Immigrants | Bangladesh | 50.0 /100 | #174 | Average 37.8% |
| Immigrants | Uruguay | 48.3 /100 | #175 | Average 37.8% |
| Costa Ricans | 47.6 /100 | #176 | Average 37.7% |
| Basques | 47.4 /100 | #177 | Average 37.7% |
| Immigrants | Cameroon | 46.8 /100 | #178 | Average 37.7% |