Argentinean vs Bermudan Bachelor's Degree
COMPARE
Argentinean
Bermudan
Bachelor's Degree
Bachelor's Degree Comparison
Argentineans
Bermudans
43.3%
BACHELOR'S DEGREE
99.7/ 100
METRIC RATING
64th/ 347
METRIC RANK
38.0%
BACHELOR'S DEGREE
54.2/ 100
METRIC RATING
171st/ 347
METRIC RANK
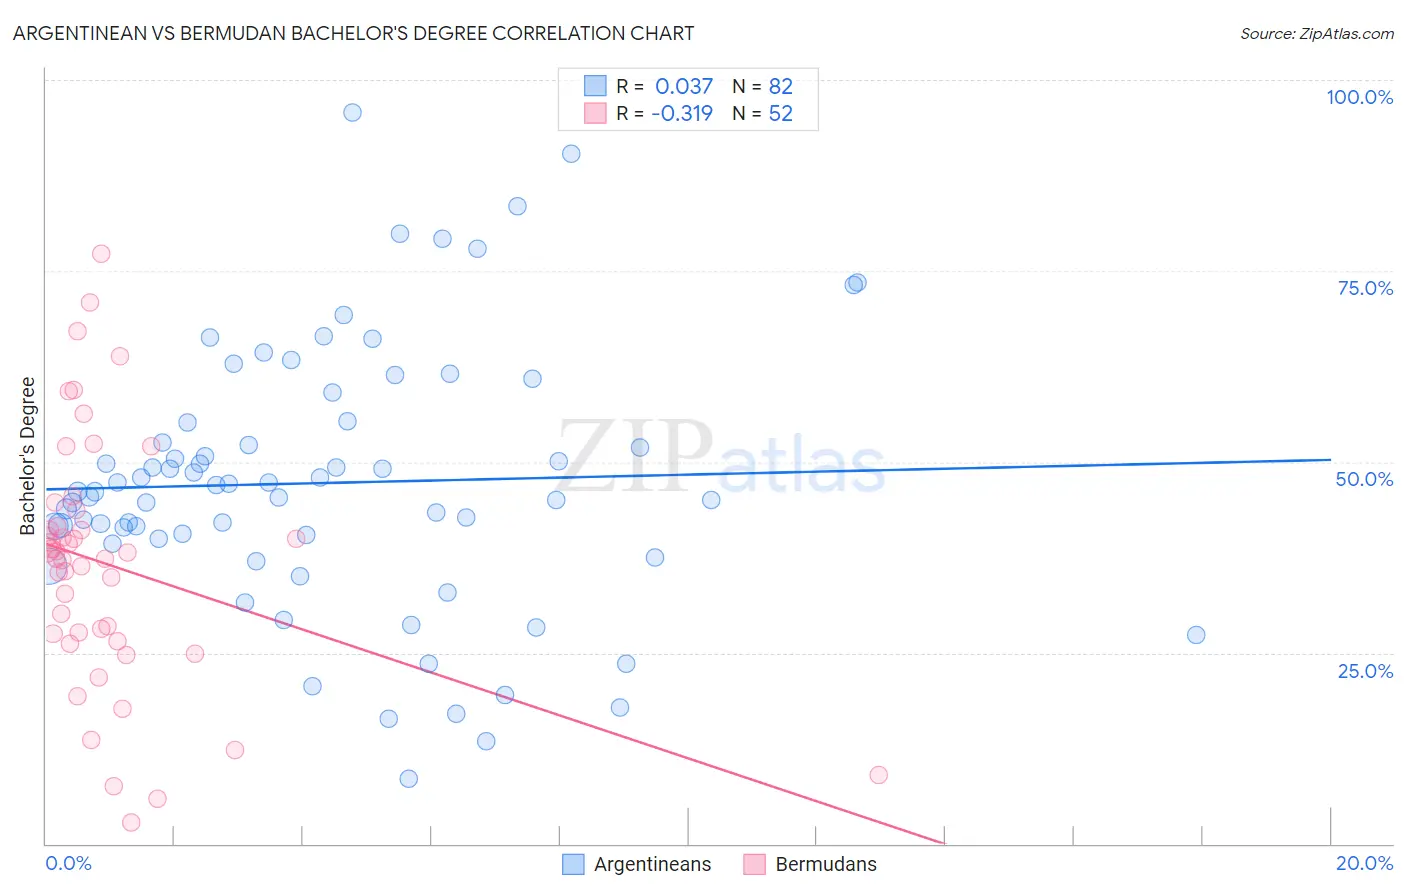
Argentinean vs Bermudan Bachelor's Degree Correlation Chart
The statistical analysis conducted on geographies consisting of 297,127,531 people shows no correlation between the proportion of Argentineans and percentage of population with at least bachelor's degree education in the United States with a correlation coefficient (R) of 0.037 and weighted average of 43.3%. Similarly, the statistical analysis conducted on geographies consisting of 55,732,325 people shows a mild negative correlation between the proportion of Bermudans and percentage of population with at least bachelor's degree education in the United States with a correlation coefficient (R) of -0.319 and weighted average of 38.0%, a difference of 14.0%.
Bachelor's Degree Correlation Summary
| Measurement | Argentinean | Bermudan |
| Minimum | 8.5% | 2.7% |
| Maximum | 95.7% | 77.3% |
| Range | 87.3% | 74.5% |
| Mean | 47.2% | 36.6% |
| Median | 46.1% | 37.7% |
| Interquartile 25% (IQ1) | 39.9% | 27.0% |
| Interquartile 75% (IQ3) | 55.1% | 42.7% |
| Interquartile Range (IQR) | 15.2% | 15.7% |
| Standard Deviation (Sample) | 17.3% | 16.3% |
| Standard Deviation (Population) | 17.1% | 16.1% |
Similar Demographics by Bachelor's Degree
Demographics Similar to Argentineans by Bachelor's Degree
In terms of bachelor's degree, the demographic groups most similar to Argentineans are Zimbabwean (43.3%, a difference of 0.0%), Immigrants from Netherlands (43.3%, a difference of 0.020%), Egyptian (43.3%, a difference of 0.050%), Immigrants from Indonesia (43.3%, a difference of 0.070%), and Immigrants from Europe (43.4%, a difference of 0.27%).
| Demographics | Rating | Rank | Bachelor's Degree |
| Paraguayans | 99.9 /100 | #57 | Exceptional 44.0% |
| Immigrants | Czechoslovakia | 99.9 /100 | #58 | Exceptional 44.0% |
| Australians | 99.9 /100 | #59 | Exceptional 44.0% |
| New Zealanders | 99.9 /100 | #60 | Exceptional 44.0% |
| South Africans | 99.8 /100 | #61 | Exceptional 43.6% |
| Immigrants | Kazakhstan | 99.8 /100 | #62 | Exceptional 43.4% |
| Immigrants | Europe | 99.8 /100 | #63 | Exceptional 43.4% |
| Argentineans | 99.7 /100 | #64 | Exceptional 43.3% |
| Zimbabweans | 99.7 /100 | #65 | Exceptional 43.3% |
| Immigrants | Netherlands | 99.7 /100 | #66 | Exceptional 43.3% |
| Egyptians | 99.7 /100 | #67 | Exceptional 43.3% |
| Immigrants | Indonesia | 99.7 /100 | #68 | Exceptional 43.3% |
| Immigrants | Pakistan | 99.7 /100 | #69 | Exceptional 43.1% |
| Immigrants | Romania | 99.6 /100 | #70 | Exceptional 42.9% |
| Immigrants | Argentina | 99.6 /100 | #71 | Exceptional 42.8% |
Demographics Similar to Bermudans by Bachelor's Degree
In terms of bachelor's degree, the demographic groups most similar to Bermudans are Czech (38.0%, a difference of 0.010%), Ghanaian (38.0%, a difference of 0.11%), Immigrants from Somalia (37.9%, a difference of 0.14%), Immigrants from Iraq (37.9%, a difference of 0.16%), and Danish (38.1%, a difference of 0.20%).
| Demographics | Rating | Rank | Bachelor's Degree |
| Hungarians | 62.1 /100 | #164 | Good 38.3% |
| Sri Lankans | 59.1 /100 | #165 | Average 38.2% |
| Somalis | 58.6 /100 | #166 | Average 38.1% |
| Scottish | 56.6 /100 | #167 | Average 38.1% |
| Danes | 56.2 /100 | #168 | Average 38.1% |
| Ghanaians | 55.3 /100 | #169 | Average 38.0% |
| Czechs | 54.4 /100 | #170 | Average 38.0% |
| Bermudans | 54.2 /100 | #171 | Average 38.0% |
| Immigrants | Somalia | 52.8 /100 | #172 | Average 37.9% |
| Immigrants | Iraq | 52.5 /100 | #173 | Average 37.9% |
| Immigrants | Bangladesh | 50.0 /100 | #174 | Average 37.8% |
| Immigrants | Uruguay | 48.3 /100 | #175 | Average 37.8% |
| Costa Ricans | 47.6 /100 | #176 | Average 37.7% |
| Basques | 47.4 /100 | #177 | Average 37.7% |
| Immigrants | Cameroon | 46.8 /100 | #178 | Average 37.7% |