Luxembourger vs Immigrants from Haiti Bachelor's Degree
COMPARE
Luxembourger
Immigrants from Haiti
Bachelor's Degree
Bachelor's Degree Comparison
Luxembourgers
Immigrants from Haiti
39.8%
BACHELOR'S DEGREE
89.1/ 100
METRIC RATING
135th/ 347
METRIC RANK
30.6%
BACHELOR'S DEGREE
0.0/ 100
METRIC RATING
297th/ 347
METRIC RANK
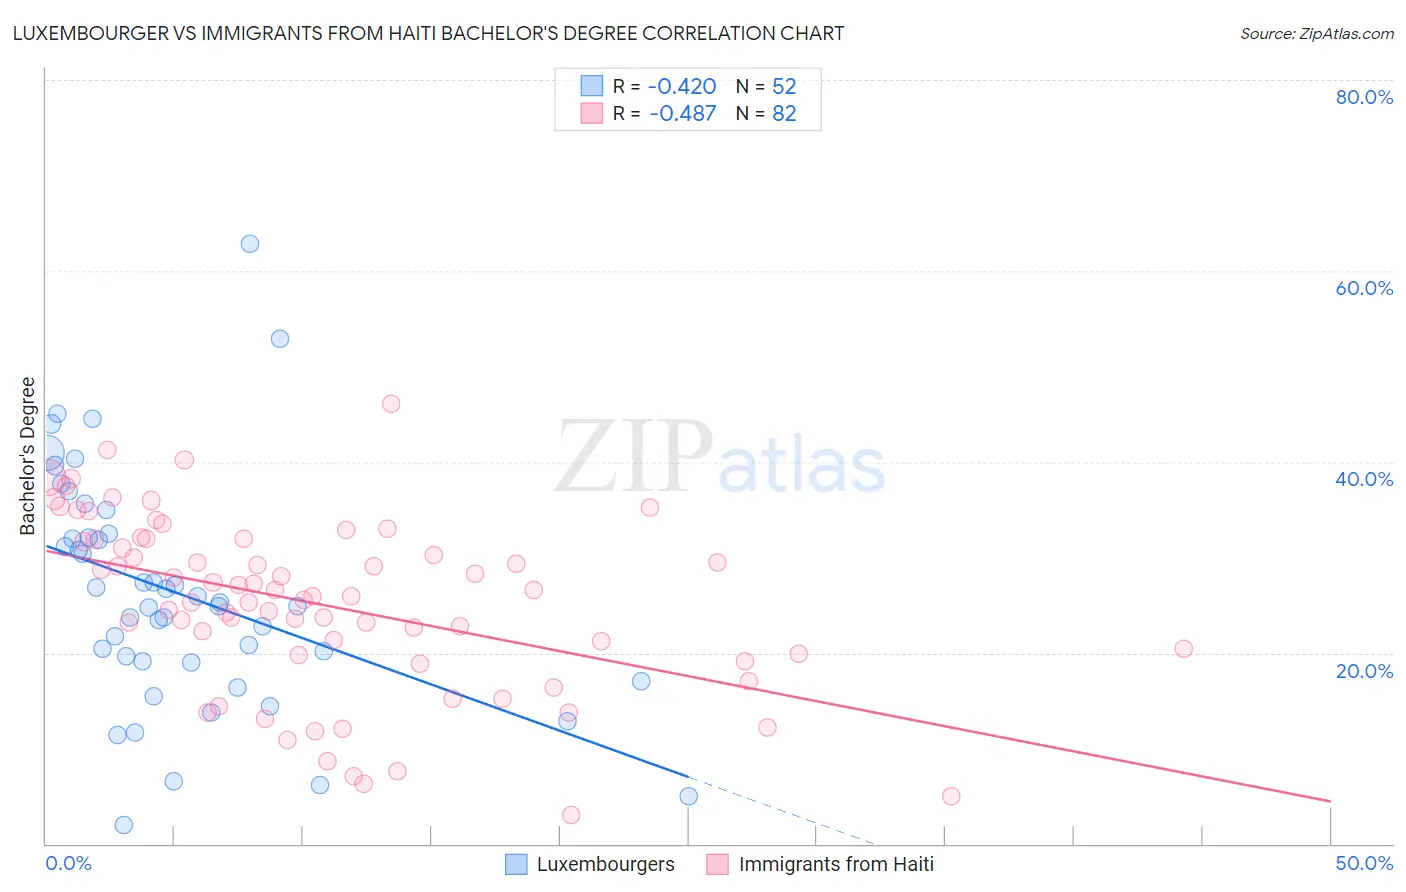
Luxembourger vs Immigrants from Haiti Bachelor's Degree Correlation Chart
The statistical analysis conducted on geographies consisting of 144,665,443 people shows a moderate negative correlation between the proportion of Luxembourgers and percentage of population with at least bachelor's degree education in the United States with a correlation coefficient (R) of -0.420 and weighted average of 39.8%. Similarly, the statistical analysis conducted on geographies consisting of 225,272,014 people shows a moderate negative correlation between the proportion of Immigrants from Haiti and percentage of population with at least bachelor's degree education in the United States with a correlation coefficient (R) of -0.487 and weighted average of 30.6%, a difference of 29.8%.
Bachelor's Degree Correlation Summary
| Measurement | Luxembourger | Immigrants from Haiti |
| Minimum | 2.0% | 3.0% |
| Maximum | 62.9% | 46.1% |
| Range | 60.9% | 43.0% |
| Mean | 26.2% | 25.0% |
| Median | 25.1% | 25.9% |
| Interquartile 25% (IQ1) | 19.0% | 19.8% |
| Interquartile 75% (IQ3) | 32.2% | 31.9% |
| Interquartile Range (IQR) | 13.2% | 12.1% |
| Standard Deviation (Sample) | 12.2% | 9.2% |
| Standard Deviation (Population) | 12.1% | 9.2% |
Similar Demographics by Bachelor's Degree
Demographics Similar to Luxembourgers by Bachelor's Degree
In terms of bachelor's degree, the demographic groups most similar to Luxembourgers are Assyrian/Chaldean/Syriac (39.8%, a difference of 0.080%), Pakistani (39.7%, a difference of 0.20%), Immigrants from Southern Europe (40.0%, a difference of 0.51%), Taiwanese (40.0%, a difference of 0.52%), and Icelander (39.5%, a difference of 0.57%).
| Demographics | Rating | Rank | Bachelor's Degree |
| Immigrants | Venezuela | 92.9 /100 | #128 | Exceptional 40.2% |
| Serbians | 92.4 /100 | #129 | Exceptional 40.1% |
| Sierra Leoneans | 92.2 /100 | #130 | Exceptional 40.1% |
| Italians | 91.9 /100 | #131 | Exceptional 40.1% |
| Taiwanese | 91.1 /100 | #132 | Exceptional 40.0% |
| Immigrants | Southern Europe | 91.1 /100 | #133 | Exceptional 40.0% |
| Assyrians/Chaldeans/Syriacs | 89.4 /100 | #134 | Excellent 39.8% |
| Luxembourgers | 89.1 /100 | #135 | Excellent 39.8% |
| Pakistanis | 88.2 /100 | #136 | Excellent 39.7% |
| Icelanders | 86.5 /100 | #137 | Excellent 39.5% |
| Europeans | 85.6 /100 | #138 | Excellent 39.5% |
| Immigrants | Sudan | 84.5 /100 | #139 | Excellent 39.4% |
| Immigrants | Armenia | 84.1 /100 | #140 | Excellent 39.4% |
| South American Indians | 83.6 /100 | #141 | Excellent 39.3% |
| Immigrants | North Macedonia | 81.6 /100 | #142 | Excellent 39.2% |
Demographics Similar to Immigrants from Haiti by Bachelor's Degree
In terms of bachelor's degree, the demographic groups most similar to Immigrants from Haiti are Puget Sound Salish (30.7%, a difference of 0.060%), Immigrants from Dominican Republic (30.7%, a difference of 0.16%), Chippewa (30.6%, a difference of 0.25%), Immigrants from Guatemala (30.8%, a difference of 0.40%), and Chickasaw (30.4%, a difference of 0.77%).
| Demographics | Rating | Rank | Bachelor's Degree |
| Immigrants | Honduras | 0.1 /100 | #290 | Tragic 30.9% |
| Blacks/African Americans | 0.1 /100 | #291 | Tragic 30.9% |
| Ute | 0.1 /100 | #292 | Tragic 30.9% |
| Cape Verdeans | 0.1 /100 | #293 | Tragic 30.9% |
| Immigrants | Guatemala | 0.0 /100 | #294 | Tragic 30.8% |
| Immigrants | Dominican Republic | 0.0 /100 | #295 | Tragic 30.7% |
| Puget Sound Salish | 0.0 /100 | #296 | Tragic 30.7% |
| Immigrants | Haiti | 0.0 /100 | #297 | Tragic 30.6% |
| Chippewa | 0.0 /100 | #298 | Tragic 30.6% |
| Chickasaw | 0.0 /100 | #299 | Tragic 30.4% |
| Immigrants | Micronesia | 0.0 /100 | #300 | Tragic 30.4% |
| Immigrants | Cuba | 0.0 /100 | #301 | Tragic 30.3% |
| Mexican American Indians | 0.0 /100 | #302 | Tragic 30.2% |
| Bangladeshis | 0.0 /100 | #303 | Tragic 30.2% |
| Cherokee | 0.0 /100 | #304 | Tragic 30.2% |