Luxembourger vs Laotian Bachelor's Degree
COMPARE
Luxembourger
Laotian
Bachelor's Degree
Bachelor's Degree Comparison
Luxembourgers
Laotians
39.8%
BACHELOR'S DEGREE
89.1/ 100
METRIC RATING
135th/ 347
METRIC RANK
42.0%
BACHELOR'S DEGREE
98.9/ 100
METRIC RATING
90th/ 347
METRIC RANK
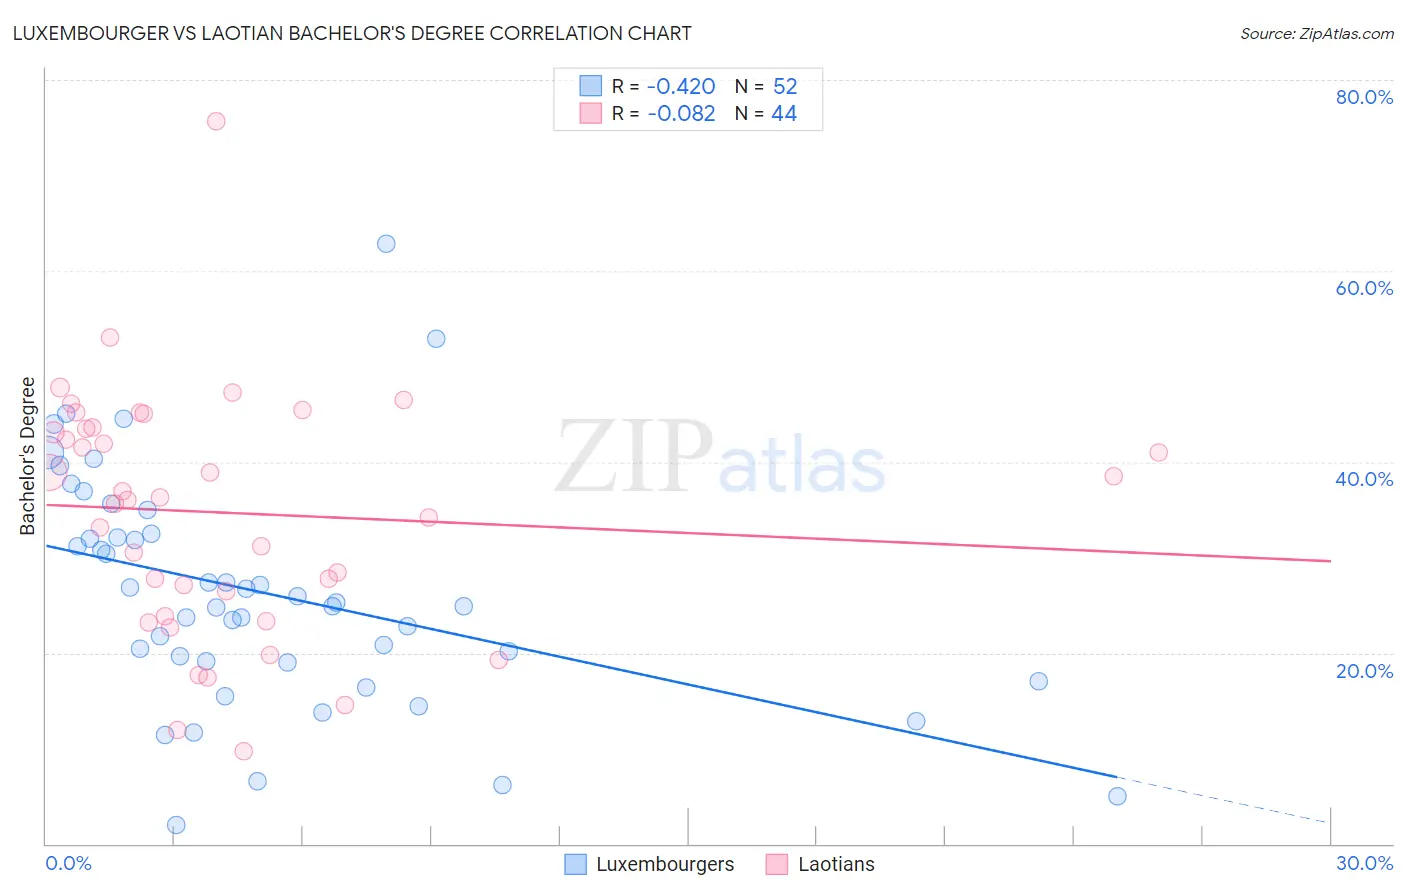
Luxembourger vs Laotian Bachelor's Degree Correlation Chart
The statistical analysis conducted on geographies consisting of 144,665,443 people shows a moderate negative correlation between the proportion of Luxembourgers and percentage of population with at least bachelor's degree education in the United States with a correlation coefficient (R) of -0.420 and weighted average of 39.8%. Similarly, the statistical analysis conducted on geographies consisting of 224,838,887 people shows a slight negative correlation between the proportion of Laotians and percentage of population with at least bachelor's degree education in the United States with a correlation coefficient (R) of -0.082 and weighted average of 42.0%, a difference of 5.6%.
Bachelor's Degree Correlation Summary
| Measurement | Luxembourger | Laotian |
| Minimum | 2.0% | 9.7% |
| Maximum | 62.9% | 75.7% |
| Range | 60.9% | 66.0% |
| Mean | 26.2% | 34.6% |
| Median | 25.1% | 36.1% |
| Interquartile 25% (IQ1) | 19.0% | 25.1% |
| Interquartile 75% (IQ3) | 32.2% | 43.5% |
| Interquartile Range (IQR) | 13.2% | 18.4% |
| Standard Deviation (Sample) | 12.2% | 12.7% |
| Standard Deviation (Population) | 12.1% | 12.6% |
Similar Demographics by Bachelor's Degree
Demographics Similar to Luxembourgers by Bachelor's Degree
In terms of bachelor's degree, the demographic groups most similar to Luxembourgers are Assyrian/Chaldean/Syriac (39.8%, a difference of 0.080%), Pakistani (39.7%, a difference of 0.20%), Immigrants from Southern Europe (40.0%, a difference of 0.51%), Taiwanese (40.0%, a difference of 0.52%), and Icelander (39.5%, a difference of 0.57%).
| Demographics | Rating | Rank | Bachelor's Degree |
| Immigrants | Venezuela | 92.9 /100 | #128 | Exceptional 40.2% |
| Serbians | 92.4 /100 | #129 | Exceptional 40.1% |
| Sierra Leoneans | 92.2 /100 | #130 | Exceptional 40.1% |
| Italians | 91.9 /100 | #131 | Exceptional 40.1% |
| Taiwanese | 91.1 /100 | #132 | Exceptional 40.0% |
| Immigrants | Southern Europe | 91.1 /100 | #133 | Exceptional 40.0% |
| Assyrians/Chaldeans/Syriacs | 89.4 /100 | #134 | Excellent 39.8% |
| Luxembourgers | 89.1 /100 | #135 | Excellent 39.8% |
| Pakistanis | 88.2 /100 | #136 | Excellent 39.7% |
| Icelanders | 86.5 /100 | #137 | Excellent 39.5% |
| Europeans | 85.6 /100 | #138 | Excellent 39.5% |
| Immigrants | Sudan | 84.5 /100 | #139 | Excellent 39.4% |
| Immigrants | Armenia | 84.1 /100 | #140 | Excellent 39.4% |
| South American Indians | 83.6 /100 | #141 | Excellent 39.3% |
| Immigrants | North Macedonia | 81.6 /100 | #142 | Excellent 39.2% |
Demographics Similar to Laotians by Bachelor's Degree
In terms of bachelor's degree, the demographic groups most similar to Laotians are Immigrants from Northern Africa (41.9%, a difference of 0.10%), Greek (42.0%, a difference of 0.12%), Immigrants from Western Europe (42.0%, a difference of 0.13%), Maltese (41.9%, a difference of 0.17%), and Carpatho Rusyn (42.1%, a difference of 0.25%).
| Demographics | Rating | Rank | Bachelor's Degree |
| Armenians | 99.2 /100 | #83 | Exceptional 42.3% |
| Immigrants | Western Asia | 99.2 /100 | #84 | Exceptional 42.3% |
| Lithuanians | 99.2 /100 | #85 | Exceptional 42.2% |
| Immigrants | Brazil | 99.2 /100 | #86 | Exceptional 42.2% |
| Carpatho Rusyns | 99.0 /100 | #87 | Exceptional 42.1% |
| Immigrants | Western Europe | 99.0 /100 | #88 | Exceptional 42.0% |
| Greeks | 99.0 /100 | #89 | Exceptional 42.0% |
| Laotians | 98.9 /100 | #90 | Exceptional 42.0% |
| Immigrants | Northern Africa | 98.9 /100 | #91 | Exceptional 41.9% |
| Maltese | 98.8 /100 | #92 | Exceptional 41.9% |
| Immigrants | Canada | 98.6 /100 | #93 | Exceptional 41.7% |
| Immigrants | Nepal | 98.6 /100 | #94 | Exceptional 41.7% |
| Immigrants | North America | 98.5 /100 | #95 | Exceptional 41.7% |
| Immigrants | Moldova | 98.4 /100 | #96 | Exceptional 41.6% |
| Romanians | 98.4 /100 | #97 | Exceptional 41.6% |