Lumbee vs Iraqi Male Disability
COMPARE
Lumbee
Iraqi
Male Disability
Male Disability Comparison
Lumbee
Iraqis
15.2%
MALE DISABILITY
0.0/ 100
METRIC RATING
340th/ 347
METRIC RANK
11.3%
MALE DISABILITY
30.5/ 100
METRIC RATING
184th/ 347
METRIC RANK
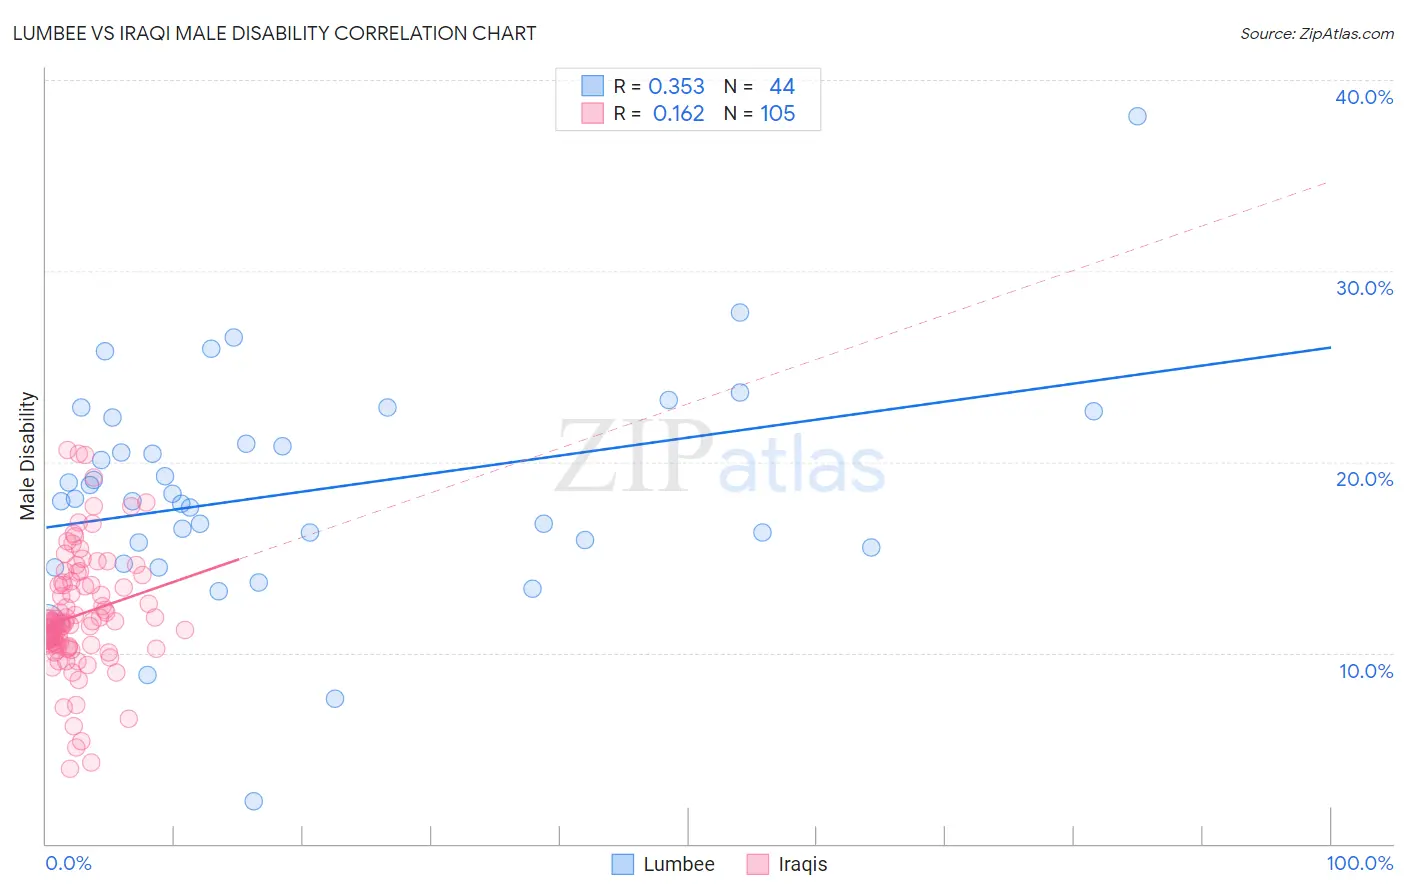
Lumbee vs Iraqi Male Disability Correlation Chart
The statistical analysis conducted on geographies consisting of 92,279,145 people shows a mild positive correlation between the proportion of Lumbee and percentage of males with a disability in the United States with a correlation coefficient (R) of 0.353 and weighted average of 15.2%. Similarly, the statistical analysis conducted on geographies consisting of 170,656,152 people shows a poor positive correlation between the proportion of Iraqis and percentage of males with a disability in the United States with a correlation coefficient (R) of 0.162 and weighted average of 11.3%, a difference of 34.3%.
Male Disability Correlation Summary
| Measurement | Lumbee | Iraqi |
| Minimum | 2.2% | 3.9% |
| Maximum | 38.1% | 20.6% |
| Range | 35.8% | 16.7% |
| Mean | 18.5% | 12.0% |
| Median | 18.0% | 11.6% |
| Interquartile 25% (IQ1) | 15.7% | 10.4% |
| Interquartile 75% (IQ3) | 21.6% | 13.6% |
| Interquartile Range (IQR) | 6.0% | 3.2% |
| Standard Deviation (Sample) | 5.9% | 3.1% |
| Standard Deviation (Population) | 5.8% | 3.1% |
Similar Demographics by Male Disability
Demographics Similar to Lumbee by Male Disability
In terms of male disability, the demographic groups most similar to Lumbee are Chickasaw (15.1%, a difference of 0.74%), Choctaw (15.4%, a difference of 1.1%), Kiowa (15.4%, a difference of 1.3%), Pueblo (15.0%, a difference of 1.5%), and Menominee (15.0%, a difference of 1.7%).
| Demographics | Rating | Rank | Male Disability |
| Yuman | 0.0 /100 | #333 | Tragic 14.7% |
| Cherokee | 0.0 /100 | #334 | Tragic 14.8% |
| Dutch West Indians | 0.0 /100 | #335 | Tragic 14.8% |
| Alaskan Athabascans | 0.0 /100 | #336 | Tragic 14.9% |
| Menominee | 0.0 /100 | #337 | Tragic 15.0% |
| Pueblo | 0.0 /100 | #338 | Tragic 15.0% |
| Chickasaw | 0.0 /100 | #339 | Tragic 15.1% |
| Lumbee | 0.0 /100 | #340 | Tragic 15.2% |
| Choctaw | 0.0 /100 | #341 | Tragic 15.4% |
| Kiowa | 0.0 /100 | #342 | Tragic 15.4% |
| Creek | 0.0 /100 | #343 | Tragic 15.5% |
| Puerto Ricans | 0.0 /100 | #344 | Tragic 15.6% |
| Tsimshian | 0.0 /100 | #345 | Tragic 15.6% |
| Colville | 0.0 /100 | #346 | Tragic 16.5% |
| Houma | 0.0 /100 | #347 | Tragic 17.4% |
Demographics Similar to Iraqis by Male Disability
In terms of male disability, the demographic groups most similar to Iraqis are Pakistani (11.3%, a difference of 0.010%), Immigrants from Central America (11.3%, a difference of 0.15%), Immigrants from Zaire (11.4%, a difference of 0.19%), Immigrants from Belize (11.3%, a difference of 0.20%), and Immigrants from Austria (11.4%, a difference of 0.21%).
| Demographics | Rating | Rank | Male Disability |
| Immigrants | Norway | 44.2 /100 | #177 | Average 11.3% |
| Australians | 42.2 /100 | #178 | Average 11.3% |
| Immigrants | Caribbean | 41.4 /100 | #179 | Average 11.3% |
| Hondurans | 41.1 /100 | #180 | Average 11.3% |
| Immigrants | Senegal | 34.4 /100 | #181 | Fair 11.3% |
| Immigrants | Belize | 33.7 /100 | #182 | Fair 11.3% |
| Immigrants | Central America | 32.9 /100 | #183 | Fair 11.3% |
| Iraqis | 30.5 /100 | #184 | Fair 11.3% |
| Pakistanis | 30.3 /100 | #185 | Fair 11.3% |
| Immigrants | Zaire | 27.6 /100 | #186 | Fair 11.4% |
| Immigrants | Austria | 27.3 /100 | #187 | Fair 11.4% |
| Estonians | 26.8 /100 | #188 | Fair 11.4% |
| Immigrants | Netherlands | 25.9 /100 | #189 | Fair 11.4% |
| Immigrants | Bosnia and Herzegovina | 25.4 /100 | #190 | Fair 11.4% |
| Senegalese | 23.2 /100 | #191 | Fair 11.4% |