Immigrants from Iran vs Iraqi Associate's Degree
COMPARE
Immigrants from Iran
Iraqi
Associate's Degree
Associate's Degree Comparison
Immigrants from Iran
Iraqis
57.7%
ASSOCIATE'S DEGREE
100.0/ 100
METRIC RATING
7th/ 347
METRIC RANK
47.4%
ASSOCIATE'S DEGREE
76.2/ 100
METRIC RATING
150th/ 347
METRIC RANK
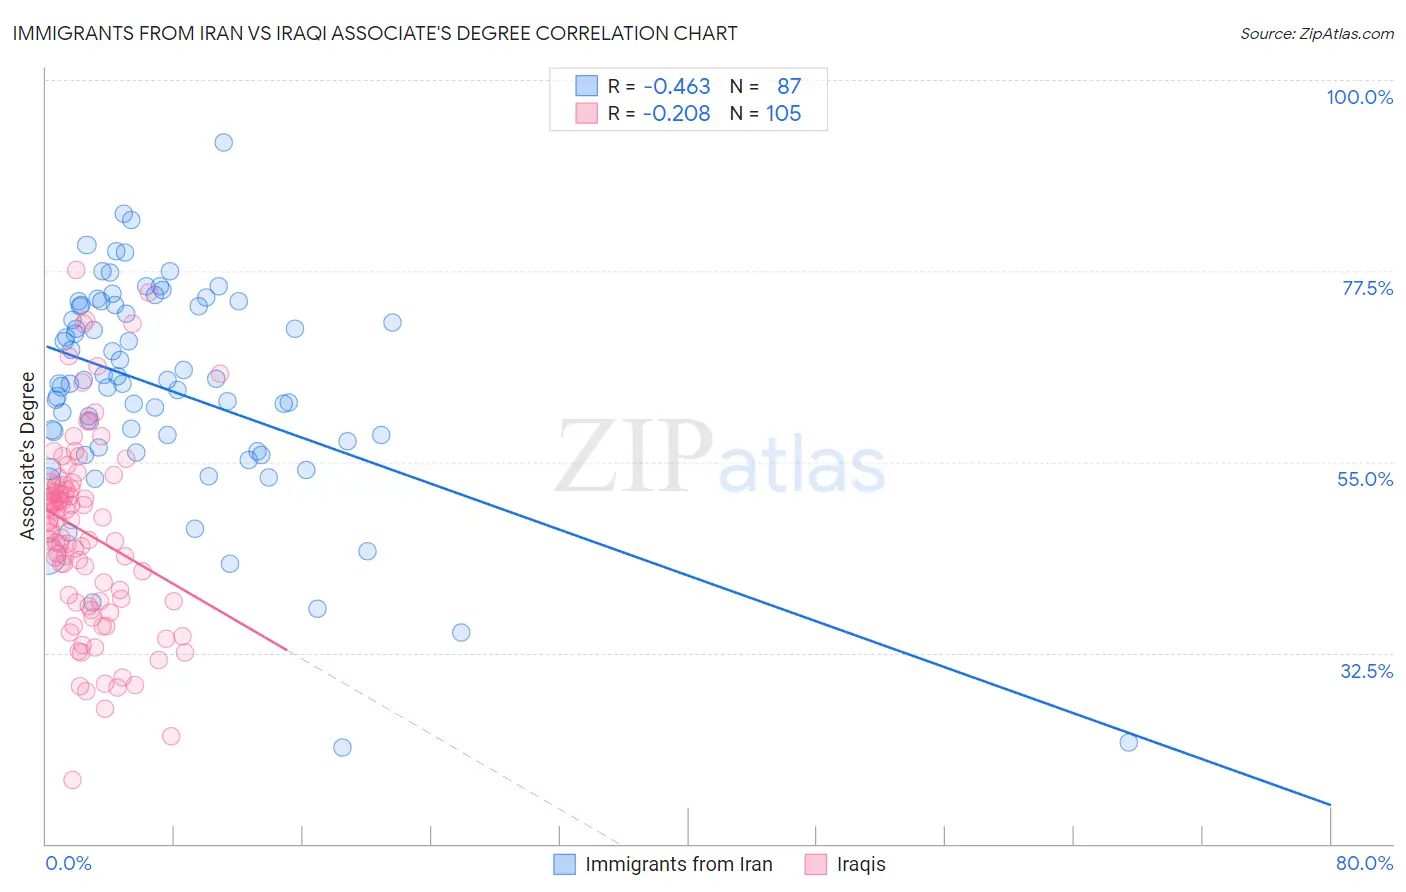
Immigrants from Iran vs Iraqi Associate's Degree Correlation Chart
The statistical analysis conducted on geographies consisting of 279,901,674 people shows a moderate negative correlation between the proportion of Immigrants from Iran and percentage of population with at least associate's degree education in the United States with a correlation coefficient (R) of -0.463 and weighted average of 57.7%. Similarly, the statistical analysis conducted on geographies consisting of 170,654,197 people shows a weak negative correlation between the proportion of Iraqis and percentage of population with at least associate's degree education in the United States with a correlation coefficient (R) of -0.208 and weighted average of 47.4%, a difference of 21.7%.
Associate's Degree Correlation Summary
| Measurement | Immigrants from Iran | Iraqi |
| Minimum | 21.3% | 17.5% |
| Maximum | 92.6% | 77.6% |
| Range | 71.3% | 60.1% |
| Mean | 63.6% | 46.6% |
| Median | 64.3% | 48.1% |
| Interquartile 25% (IQ1) | 56.7% | 38.4% |
| Interquartile 75% (IQ3) | 73.4% | 52.3% |
| Interquartile Range (IQR) | 16.8% | 13.8% |
| Standard Deviation (Sample) | 12.7% | 11.5% |
| Standard Deviation (Population) | 12.7% | 11.4% |
Similar Demographics by Associate's Degree
Demographics Similar to Immigrants from Iran by Associate's Degree
In terms of associate's degree, the demographic groups most similar to Immigrants from Iran are Okinawan (57.7%, a difference of 0.060%), Thai (57.4%, a difference of 0.40%), Iranian (58.2%, a difference of 0.89%), Immigrants from Taiwan (58.4%, a difference of 1.3%), and Immigrants from Israel (56.8%, a difference of 1.5%).
| Demographics | Rating | Rank | Associate's Degree |
| Filipinos | 100.0 /100 | #1 | Exceptional 59.8% |
| Immigrants | Singapore | 100.0 /100 | #2 | Exceptional 58.9% |
| Immigrants | India | 100.0 /100 | #3 | Exceptional 58.5% |
| Immigrants | Taiwan | 100.0 /100 | #4 | Exceptional 58.4% |
| Iranians | 100.0 /100 | #5 | Exceptional 58.2% |
| Okinawans | 100.0 /100 | #6 | Exceptional 57.7% |
| Immigrants | Iran | 100.0 /100 | #7 | Exceptional 57.7% |
| Thais | 100.0 /100 | #8 | Exceptional 57.4% |
| Immigrants | Israel | 100.0 /100 | #9 | Exceptional 56.8% |
| Cypriots | 100.0 /100 | #10 | Exceptional 56.4% |
| Immigrants | Australia | 100.0 /100 | #11 | Exceptional 55.8% |
| Immigrants | South Central Asia | 100.0 /100 | #12 | Exceptional 55.7% |
| Immigrants | China | 100.0 /100 | #13 | Exceptional 55.5% |
| Immigrants | Hong Kong | 100.0 /100 | #14 | Exceptional 55.4% |
| Immigrants | Eastern Asia | 100.0 /100 | #15 | Exceptional 55.4% |
Demographics Similar to Iraqis by Associate's Degree
In terms of associate's degree, the demographic groups most similar to Iraqis are Immigrants from North Macedonia (47.4%, a difference of 0.020%), Immigrants from Armenia (47.4%, a difference of 0.040%), South American Indian (47.4%, a difference of 0.050%), Danish (47.4%, a difference of 0.11%), and Immigrants from Sudan (47.4%, a difference of 0.17%).
| Demographics | Rating | Rank | Associate's Degree |
| Norwegians | 81.0 /100 | #143 | Excellent 47.6% |
| Slavs | 80.5 /100 | #144 | Excellent 47.6% |
| Canadians | 79.0 /100 | #145 | Good 47.5% |
| Immigrants | Sudan | 77.9 /100 | #146 | Good 47.4% |
| Danes | 77.3 /100 | #147 | Good 47.4% |
| South American Indians | 76.7 /100 | #148 | Good 47.4% |
| Immigrants | Armenia | 76.6 /100 | #149 | Good 47.4% |
| Iraqis | 76.2 /100 | #150 | Good 47.4% |
| Immigrants | North Macedonia | 76.0 /100 | #151 | Good 47.4% |
| Immigrants | Afghanistan | 74.3 /100 | #152 | Good 47.3% |
| Czechs | 72.2 /100 | #153 | Good 47.2% |
| Immigrants | Kenya | 72.1 /100 | #154 | Good 47.2% |
| Kenyans | 70.6 /100 | #155 | Good 47.1% |
| South Americans | 70.5 /100 | #156 | Good 47.1% |
| Sudanese | 70.3 /100 | #157 | Good 47.1% |