Lumbee vs Iraqi College, 1 year or more
COMPARE
Lumbee
Iraqi
College, 1 year or more
College, 1 year or more Comparison
Lumbee
Iraqis
48.9%
COLLEGE, 1 YEAR OR MORE
0.0/ 100
METRIC RATING
334th/ 347
METRIC RANK
60.7%
COLLEGE, 1 YEAR OR MORE
83.3/ 100
METRIC RATING
140th/ 347
METRIC RANK
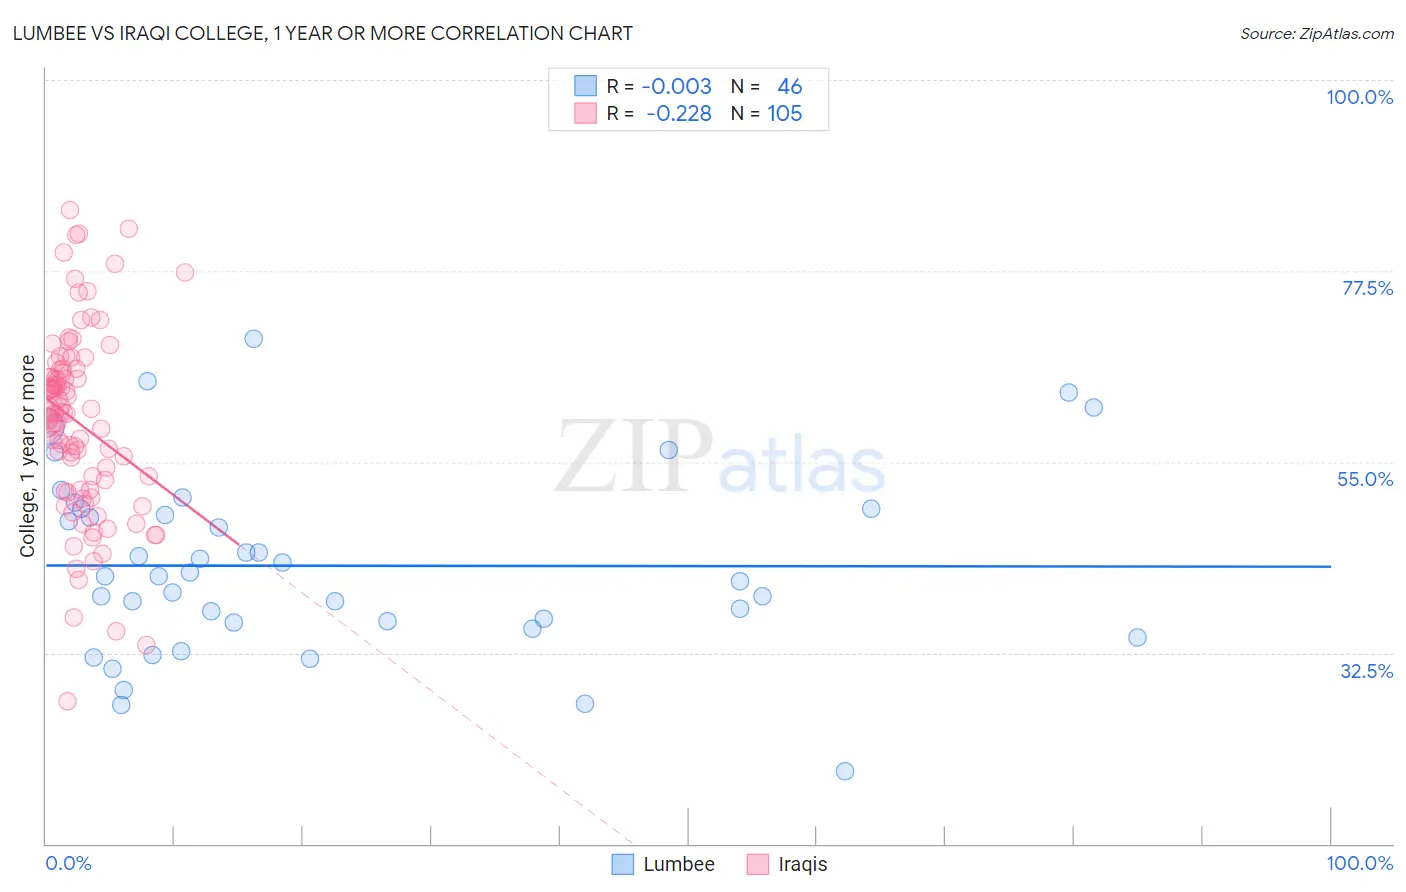
Lumbee vs Iraqi College, 1 year or more Correlation Chart
The statistical analysis conducted on geographies consisting of 92,299,068 people shows no correlation between the proportion of Lumbee and percentage of population with at least college, 1 year or more education in the United States with a correlation coefficient (R) of -0.003 and weighted average of 48.9%. Similarly, the statistical analysis conducted on geographies consisting of 170,654,197 people shows a weak negative correlation between the proportion of Iraqis and percentage of population with at least college, 1 year or more education in the United States with a correlation coefficient (R) of -0.228 and weighted average of 60.7%, a difference of 24.2%.
College, 1 year or more Correlation Summary
| Measurement | Lumbee | Iraqi |
| Minimum | 18.5% | 26.8% |
| Maximum | 69.5% | 84.7% |
| Range | 51.0% | 57.8% |
| Mean | 42.8% | 59.6% |
| Median | 41.5% | 60.8% |
| Interquartile 25% (IQ1) | 36.0% | 51.7% |
| Interquartile 75% (IQ3) | 49.4% | 65.6% |
| Interquartile Range (IQR) | 13.4% | 13.9% |
| Standard Deviation (Sample) | 10.9% | 10.9% |
| Standard Deviation (Population) | 10.8% | 10.8% |
Similar Demographics by College, 1 year or more
Demographics Similar to Lumbee by College, 1 year or more
In terms of college, 1 year or more, the demographic groups most similar to Lumbee are Yuman (48.7%, a difference of 0.28%), Immigrants from Dominican Republic (49.1%, a difference of 0.58%), Spanish American Indian (48.5%, a difference of 0.72%), Pennsylvania German (48.5%, a difference of 0.73%), and Mexican (49.2%, a difference of 0.75%).
| Demographics | Rating | Rank | College, 1 year or more |
| Menominee | 0.0 /100 | #327 | Tragic 50.6% |
| Dutch West Indians | 0.0 /100 | #328 | Tragic 50.5% |
| Cape Verdeans | 0.0 /100 | #329 | Tragic 50.3% |
| Natives/Alaskans | 0.0 /100 | #330 | Tragic 50.2% |
| Immigrants | Yemen | 0.0 /100 | #331 | Tragic 50.0% |
| Mexicans | 0.0 /100 | #332 | Tragic 49.2% |
| Immigrants | Dominican Republic | 0.0 /100 | #333 | Tragic 49.1% |
| Lumbee | 0.0 /100 | #334 | Tragic 48.9% |
| Yuman | 0.0 /100 | #335 | Tragic 48.7% |
| Spanish American Indians | 0.0 /100 | #336 | Tragic 48.5% |
| Pennsylvania Germans | 0.0 /100 | #337 | Tragic 48.5% |
| Immigrants | Central America | 0.0 /100 | #338 | Tragic 48.5% |
| Immigrants | Azores | 0.0 /100 | #339 | Tragic 48.4% |
| Immigrants | Cabo Verde | 0.0 /100 | #340 | Tragic 48.1% |
| Immigrants | Mexico | 0.0 /100 | #341 | Tragic 47.5% |
Demographics Similar to Iraqis by College, 1 year or more
In terms of college, 1 year or more, the demographic groups most similar to Iraqis are Immigrants from Afghanistan (60.7%, a difference of 0.020%), Polish (60.7%, a difference of 0.050%), Canadian (60.6%, a difference of 0.050%), Immigrants from Eritrea (60.7%, a difference of 0.090%), and Taiwanese (60.7%, a difference of 0.10%).
| Demographics | Rating | Rank | College, 1 year or more |
| Immigrants | Uzbekistan | 88.0 /100 | #133 | Excellent 61.0% |
| Immigrants | Venezuela | 87.9 /100 | #134 | Excellent 61.0% |
| Immigrants | Uganda | 87.4 /100 | #135 | Excellent 60.9% |
| Basques | 87.2 /100 | #136 | Excellent 60.9% |
| Slovenes | 86.5 /100 | #137 | Excellent 60.9% |
| Taiwanese | 84.3 /100 | #138 | Excellent 60.7% |
| Immigrants | Eritrea | 84.3 /100 | #139 | Excellent 60.7% |
| Iraqis | 83.3 /100 | #140 | Excellent 60.7% |
| Immigrants | Afghanistan | 83.1 /100 | #141 | Excellent 60.7% |
| Poles | 82.8 /100 | #142 | Excellent 60.7% |
| Canadians | 82.7 /100 | #143 | Excellent 60.6% |
| Czechs | 81.9 /100 | #144 | Excellent 60.6% |
| Slavs | 81.1 /100 | #145 | Excellent 60.6% |
| Scottish | 80.2 /100 | #146 | Excellent 60.5% |
| Immigrants | Kenya | 79.1 /100 | #147 | Good 60.5% |