Lumbee vs Immigrants from Haiti In Labor Force | Age 16-19
COMPARE
Lumbee
Immigrants from Haiti
In Labor Force | Age 16-19
In Labor Force | Age 16-19 Comparison
Lumbee
Immigrants from Haiti
31.0%
IN LABOR FORCE | AGE 16-19
0.0/ 100
METRIC RATING
330th/ 347
METRIC RANK
33.2%
IN LABOR FORCE | AGE 16-19
0.1/ 100
METRIC RATING
297th/ 347
METRIC RANK
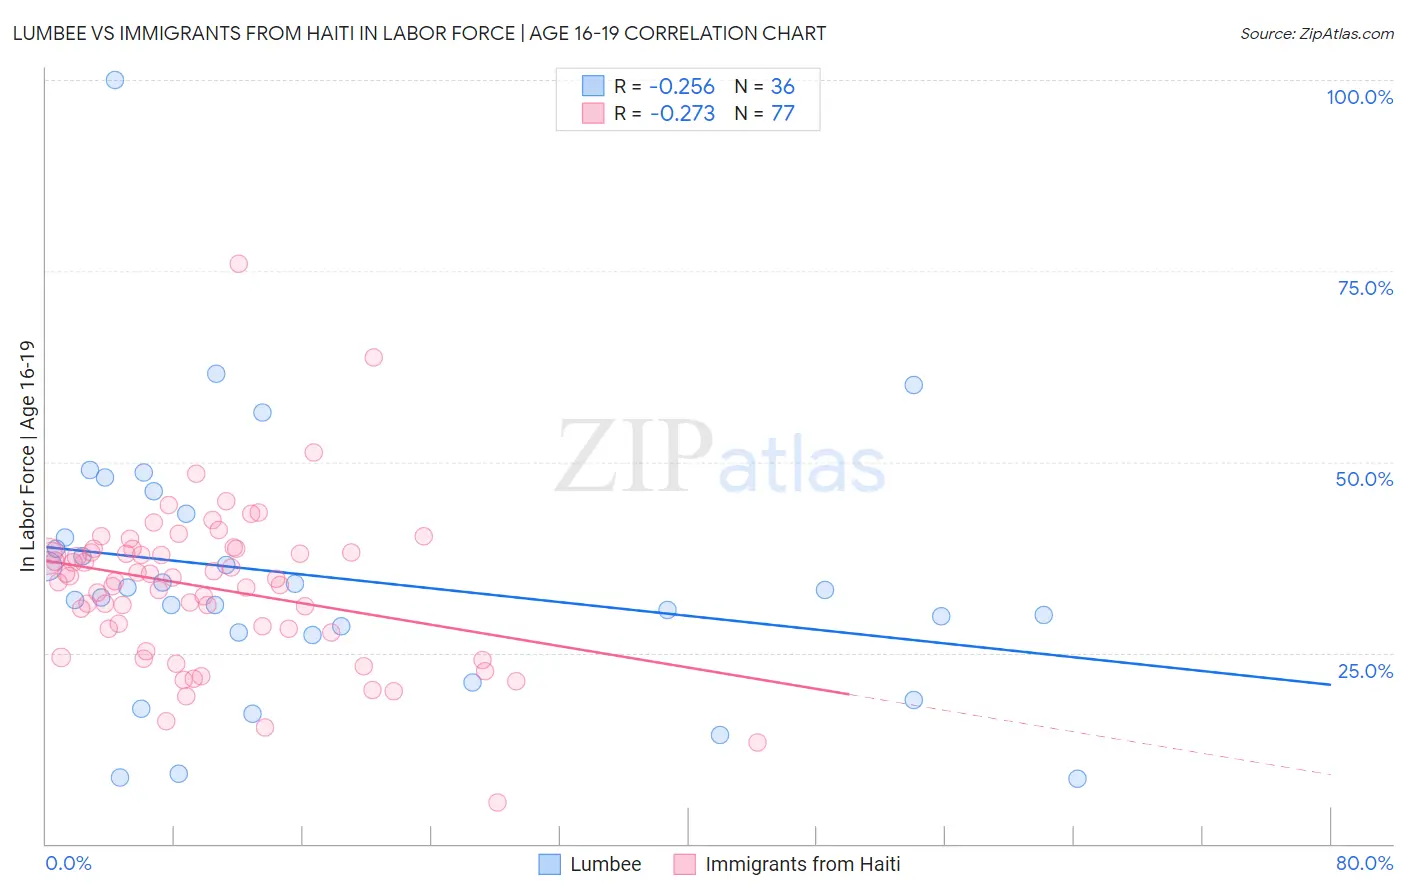
Lumbee vs Immigrants from Haiti In Labor Force | Age 16-19 Correlation Chart
The statistical analysis conducted on geographies consisting of 92,241,195 people shows a weak negative correlation between the proportion of Lumbee and labor force participation rate among population between the ages 16 and 19 in the United States with a correlation coefficient (R) of -0.256 and weighted average of 31.0%. Similarly, the statistical analysis conducted on geographies consisting of 225,034,404 people shows a weak negative correlation between the proportion of Immigrants from Haiti and labor force participation rate among population between the ages 16 and 19 in the United States with a correlation coefficient (R) of -0.273 and weighted average of 33.2%, a difference of 7.1%.
In Labor Force | Age 16-19 Correlation Summary
| Measurement | Lumbee | Immigrants from Haiti |
| Minimum | 8.5% | 5.3% |
| Maximum | 100.0% | 76.0% |
| Range | 91.5% | 70.7% |
| Mean | 34.8% | 33.5% |
| Median | 32.7% | 34.6% |
| Interquartile 25% (IQ1) | 27.5% | 27.9% |
| Interquartile 75% (IQ3) | 41.7% | 38.3% |
| Interquartile Range (IQR) | 14.2% | 10.5% |
| Standard Deviation (Sample) | 17.4% | 10.4% |
| Standard Deviation (Population) | 17.2% | 10.3% |
Similar Demographics by In Labor Force | Age 16-19
Demographics Similar to Lumbee by In Labor Force | Age 16-19
In terms of in labor force | age 16-19, the demographic groups most similar to Lumbee are Barbadian (31.0%, a difference of 0.12%), Immigrants from Ecuador (31.0%, a difference of 0.15%), Trinidadian and Tobagonian (30.9%, a difference of 0.15%), Immigrants from Taiwan (31.0%, a difference of 0.19%), and Immigrants from Dominican Republic (31.1%, a difference of 0.35%).
| Demographics | Rating | Rank | In Labor Force | Age 16-19 |
| Immigrants | Caribbean | 0.0 /100 | #323 | Tragic 31.2% |
| Dominicans | 0.0 /100 | #324 | Tragic 31.2% |
| Immigrants | China | 0.0 /100 | #325 | Tragic 31.1% |
| Immigrants | Dominican Republic | 0.0 /100 | #326 | Tragic 31.1% |
| Immigrants | Taiwan | 0.0 /100 | #327 | Tragic 31.0% |
| Immigrants | Ecuador | 0.0 /100 | #328 | Tragic 31.0% |
| Barbadians | 0.0 /100 | #329 | Tragic 31.0% |
| Lumbee | 0.0 /100 | #330 | Tragic 31.0% |
| Trinidadians and Tobagonians | 0.0 /100 | #331 | Tragic 30.9% |
| Immigrants | Israel | 0.0 /100 | #332 | Tragic 30.5% |
| Immigrants | Hong Kong | 0.0 /100 | #333 | Tragic 30.5% |
| Puerto Ricans | 0.0 /100 | #334 | Tragic 30.3% |
| Immigrants | Cuba | 0.0 /100 | #335 | Tragic 30.2% |
| Immigrants | Trinidad and Tobago | 0.0 /100 | #336 | Tragic 30.2% |
| Immigrants | Bangladesh | 0.0 /100 | #337 | Tragic 30.0% |
Demographics Similar to Immigrants from Haiti by In Labor Force | Age 16-19
In terms of in labor force | age 16-19, the demographic groups most similar to Immigrants from Haiti are Jamaican (33.2%, a difference of 0.090%), Yup'ik (33.3%, a difference of 0.22%), Argentinean (33.3%, a difference of 0.33%), Immigrants from South America (33.3%, a difference of 0.34%), and Iranian (33.0%, a difference of 0.51%).
| Demographics | Rating | Rank | In Labor Force | Age 16-19 |
| Immigrants | Colombia | 0.1 /100 | #290 | Tragic 33.5% |
| Immigrants | Belarus | 0.1 /100 | #291 | Tragic 33.4% |
| Haitians | 0.1 /100 | #292 | Tragic 33.4% |
| Immigrants | South America | 0.1 /100 | #293 | Tragic 33.3% |
| Argentineans | 0.1 /100 | #294 | Tragic 33.3% |
| Yup'ik | 0.1 /100 | #295 | Tragic 33.3% |
| Jamaicans | 0.1 /100 | #296 | Tragic 33.2% |
| Immigrants | Haiti | 0.1 /100 | #297 | Tragic 33.2% |
| Iranians | 0.0 /100 | #298 | Tragic 33.0% |
| Armenians | 0.0 /100 | #299 | Tragic 32.9% |
| Immigrants | Argentina | 0.0 /100 | #300 | Tragic 32.9% |
| Okinawans | 0.0 /100 | #301 | Tragic 32.8% |
| Belizeans | 0.0 /100 | #302 | Tragic 32.8% |
| Immigrants | Dominica | 0.0 /100 | #303 | Tragic 32.5% |
| Israelis | 0.0 /100 | #304 | Tragic 32.4% |