Lumbee vs Immigrants from Haiti Male Disability
COMPARE
Lumbee
Immigrants from Haiti
Male Disability
Male Disability Comparison
Lumbee
Immigrants from Haiti
15.2%
MALE DISABILITY
0.0/ 100
METRIC RATING
340th/ 347
METRIC RANK
11.1%
MALE DISABILITY
65.3/ 100
METRIC RATING
162nd/ 347
METRIC RANK
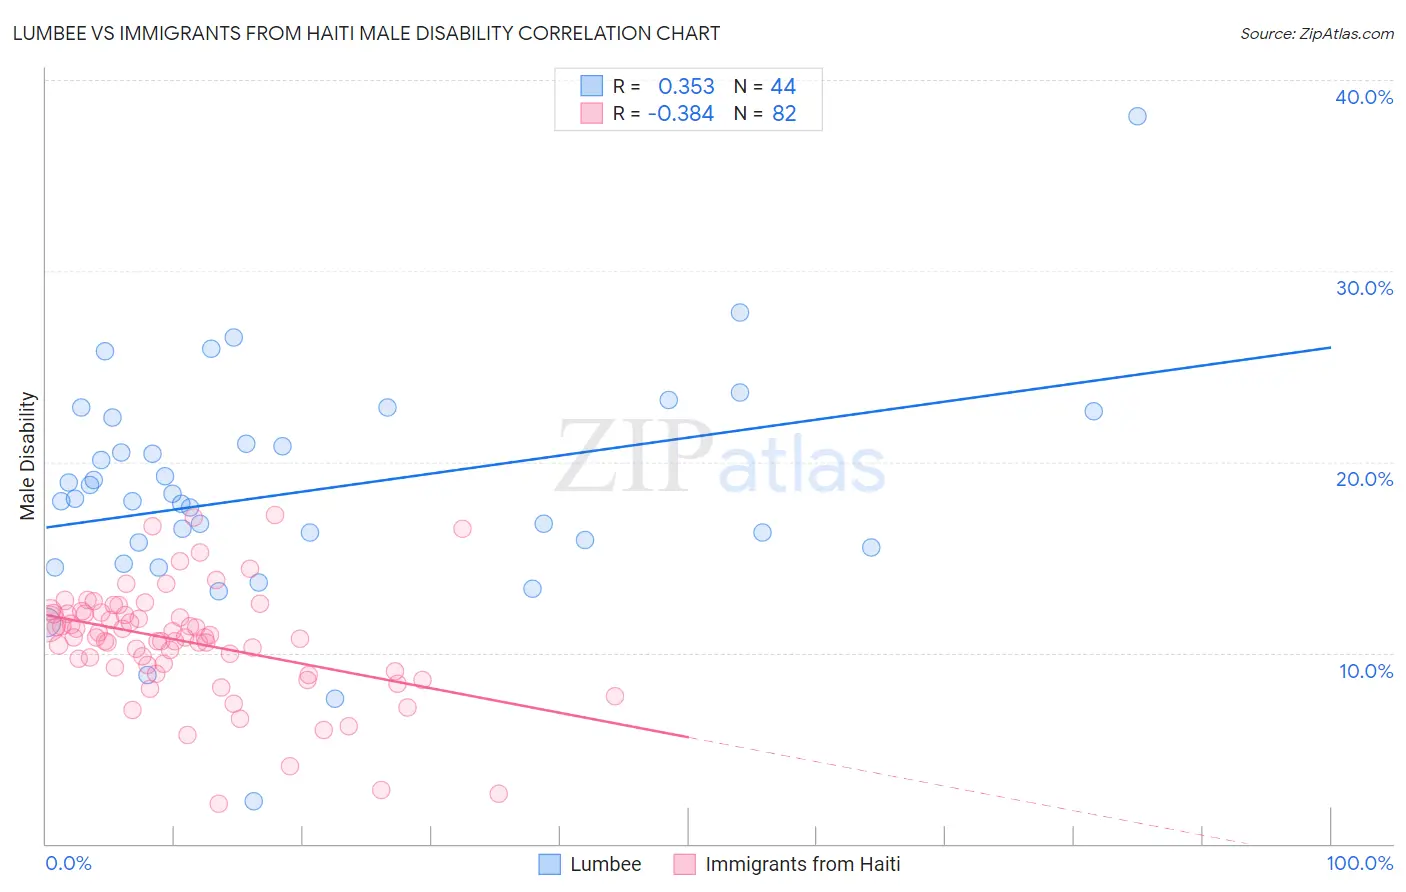
Lumbee vs Immigrants from Haiti Male Disability Correlation Chart
The statistical analysis conducted on geographies consisting of 92,279,145 people shows a mild positive correlation between the proportion of Lumbee and percentage of males with a disability in the United States with a correlation coefficient (R) of 0.353 and weighted average of 15.2%. Similarly, the statistical analysis conducted on geographies consisting of 225,231,442 people shows a mild negative correlation between the proportion of Immigrants from Haiti and percentage of males with a disability in the United States with a correlation coefficient (R) of -0.384 and weighted average of 11.1%, a difference of 37.0%.
Male Disability Correlation Summary
| Measurement | Lumbee | Immigrants from Haiti |
| Minimum | 2.2% | 2.1% |
| Maximum | 38.1% | 17.2% |
| Range | 35.8% | 15.1% |
| Mean | 18.5% | 10.6% |
| Median | 18.0% | 10.8% |
| Interquartile 25% (IQ1) | 15.7% | 9.2% |
| Interquartile 75% (IQ3) | 21.6% | 12.1% |
| Interquartile Range (IQR) | 6.0% | 2.8% |
| Standard Deviation (Sample) | 5.9% | 2.9% |
| Standard Deviation (Population) | 5.8% | 2.9% |
Similar Demographics by Male Disability
Demographics Similar to Lumbee by Male Disability
In terms of male disability, the demographic groups most similar to Lumbee are Chickasaw (15.1%, a difference of 0.74%), Choctaw (15.4%, a difference of 1.1%), Kiowa (15.4%, a difference of 1.3%), Pueblo (15.0%, a difference of 1.5%), and Menominee (15.0%, a difference of 1.7%).
| Demographics | Rating | Rank | Male Disability |
| Yuman | 0.0 /100 | #333 | Tragic 14.7% |
| Cherokee | 0.0 /100 | #334 | Tragic 14.8% |
| Dutch West Indians | 0.0 /100 | #335 | Tragic 14.8% |
| Alaskan Athabascans | 0.0 /100 | #336 | Tragic 14.9% |
| Menominee | 0.0 /100 | #337 | Tragic 15.0% |
| Pueblo | 0.0 /100 | #338 | Tragic 15.0% |
| Chickasaw | 0.0 /100 | #339 | Tragic 15.1% |
| Lumbee | 0.0 /100 | #340 | Tragic 15.2% |
| Choctaw | 0.0 /100 | #341 | Tragic 15.4% |
| Kiowa | 0.0 /100 | #342 | Tragic 15.4% |
| Creek | 0.0 /100 | #343 | Tragic 15.5% |
| Puerto Ricans | 0.0 /100 | #344 | Tragic 15.6% |
| Tsimshian | 0.0 /100 | #345 | Tragic 15.6% |
| Colville | 0.0 /100 | #346 | Tragic 16.5% |
| Houma | 0.0 /100 | #347 | Tragic 17.4% |
Demographics Similar to Immigrants from Haiti by Male Disability
In terms of male disability, the demographic groups most similar to Immigrants from Haiti are Immigrants from West Indies (11.1%, a difference of 0.020%), Albanian (11.1%, a difference of 0.070%), Immigrants from Kenya (11.1%, a difference of 0.090%), Guatemalan (11.1%, a difference of 0.12%), and British West Indian (11.1%, a difference of 0.15%).
| Demographics | Rating | Rank | Male Disability |
| Immigrants | Middle Africa | 70.9 /100 | #155 | Good 11.1% |
| Russians | 69.8 /100 | #156 | Good 11.1% |
| Immigrants | Western Africa | 69.2 /100 | #157 | Good 11.1% |
| Latvians | 68.1 /100 | #158 | Good 11.1% |
| Guatemalans | 67.2 /100 | #159 | Good 11.1% |
| Albanians | 66.5 /100 | #160 | Good 11.1% |
| Immigrants | West Indies | 65.7 /100 | #161 | Good 11.1% |
| Immigrants | Haiti | 65.3 /100 | #162 | Good 11.1% |
| Immigrants | Kenya | 63.8 /100 | #163 | Good 11.1% |
| British West Indians | 62.8 /100 | #164 | Good 11.1% |
| Luxembourgers | 61.9 /100 | #165 | Good 11.1% |
| Immigrants | Hungary | 61.2 /100 | #166 | Good 11.1% |
| Immigrants | Southern Europe | 54.4 /100 | #167 | Average 11.2% |
| Immigrants | Latin America | 54.0 /100 | #168 | Average 11.2% |
| Barbadians | 53.4 /100 | #169 | Average 11.2% |