Immigrants from Albania vs Slovene No Schooling Completed
COMPARE
Immigrants from Albania
Slovene
No Schooling Completed
No Schooling Completed Comparison
Immigrants from Albania
Slovenes
2.2%
NO SCHOOLING COMPLETED
28.3/ 100
METRIC RATING
194th/ 347
METRIC RANK
1.4%
NO SCHOOLING COMPLETED
100.0/ 100
METRIC RATING
5th/ 347
METRIC RANK
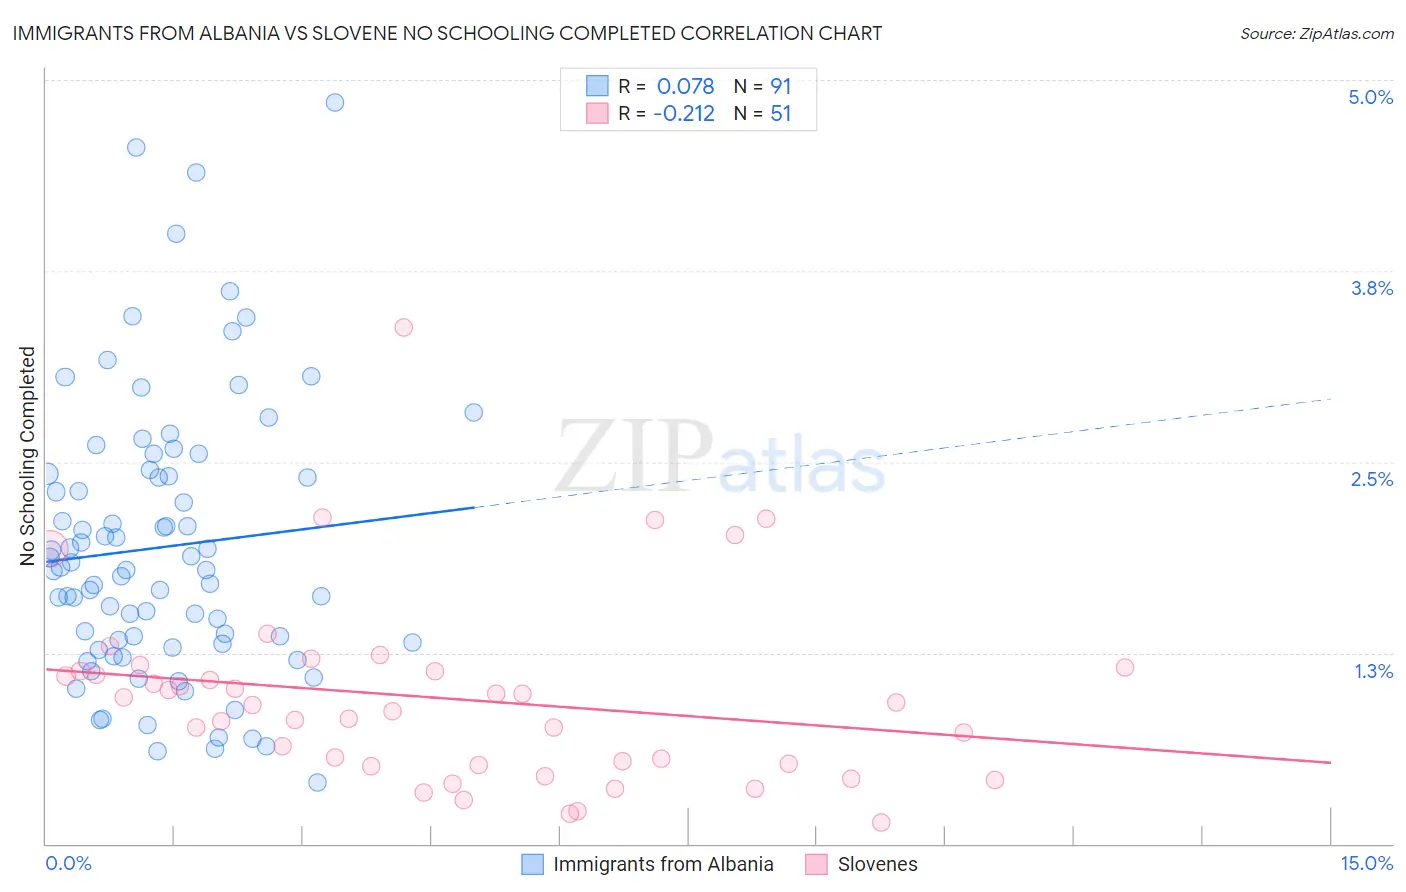
Immigrants from Albania vs Slovene No Schooling Completed Correlation Chart
The statistical analysis conducted on geographies consisting of 118,975,622 people shows a slight positive correlation between the proportion of Immigrants from Albania and percentage of population with no schooling in the United States with a correlation coefficient (R) of 0.078 and weighted average of 2.2%. Similarly, the statistical analysis conducted on geographies consisting of 258,600,541 people shows a weak negative correlation between the proportion of Slovenes and percentage of population with no schooling in the United States with a correlation coefficient (R) of -0.212 and weighted average of 1.4%, a difference of 58.4%.
No Schooling Completed Correlation Summary
| Measurement | Immigrants from Albania | Slovene |
| Minimum | 0.40% | 0.14% |
| Maximum | 4.9% | 3.4% |
| Range | 4.5% | 3.2% |
| Mean | 1.9% | 0.95% |
| Median | 1.8% | 0.91% |
| Interquartile 25% (IQ1) | 1.3% | 0.51% |
| Interquartile 75% (IQ3) | 2.4% | 1.1% |
| Interquartile Range (IQR) | 1.1% | 0.62% |
| Standard Deviation (Sample) | 0.91% | 0.61% |
| Standard Deviation (Population) | 0.90% | 0.60% |
Similar Demographics by No Schooling Completed
Demographics Similar to Immigrants from Albania by No Schooling Completed
In terms of no schooling completed, the demographic groups most similar to Immigrants from Albania are Paraguayan (2.2%, a difference of 0.17%), Hawaiian (2.2%, a difference of 0.20%), Guamanian/Chamorro (2.2%, a difference of 0.24%), Immigrants from Ukraine (2.2%, a difference of 0.35%), and Bermudan (2.1%, a difference of 0.38%).
| Demographics | Rating | Rank | No Schooling Completed |
| Navajo | 36.5 /100 | #187 | Fair 2.1% |
| Immigrants | Kenya | 36.2 /100 | #188 | Fair 2.1% |
| Immigrants | Egypt | 36.1 /100 | #189 | Fair 2.1% |
| Spanish Americans | 32.6 /100 | #190 | Fair 2.1% |
| Bermudans | 30.7 /100 | #191 | Fair 2.1% |
| Guamanians/Chamorros | 29.8 /100 | #192 | Fair 2.2% |
| Paraguayans | 29.3 /100 | #193 | Fair 2.2% |
| Immigrants | Albania | 28.3 /100 | #194 | Fair 2.2% |
| Hawaiians | 27.0 /100 | #195 | Fair 2.2% |
| Immigrants | Ukraine | 26.1 /100 | #196 | Fair 2.2% |
| Immigrants | Southern Europe | 23.8 /100 | #197 | Fair 2.2% |
| Immigrants | Chile | 22.7 /100 | #198 | Fair 2.2% |
| Africans | 21.8 /100 | #199 | Fair 2.2% |
| Immigrants | Northern Africa | 19.5 /100 | #200 | Poor 2.2% |
| Costa Ricans | 17.1 /100 | #201 | Poor 2.2% |
Demographics Similar to Slovenes by No Schooling Completed
In terms of no schooling completed, the demographic groups most similar to Slovenes are German (1.4%, a difference of 0.42%), Carpatho Rusyn (1.4%, a difference of 0.82%), Norwegian (1.3%, a difference of 0.98%), Slovak (1.3%, a difference of 1.4%), and English (1.4%, a difference of 1.8%).
| Demographics | Rating | Rank | No Schooling Completed |
| Yup'ik | 100.0 /100 | #1 | Exceptional 1.2% |
| Slovaks | 100.0 /100 | #2 | Exceptional 1.3% |
| Norwegians | 100.0 /100 | #3 | Exceptional 1.3% |
| Germans | 100.0 /100 | #4 | Exceptional 1.4% |
| Slovenes | 100.0 /100 | #5 | Exceptional 1.4% |
| Carpatho Rusyns | 100.0 /100 | #6 | Exceptional 1.4% |
| English | 100.0 /100 | #7 | Exceptional 1.4% |
| Swedes | 100.0 /100 | #8 | Exceptional 1.4% |
| Scottish | 100.0 /100 | #9 | Exceptional 1.4% |
| Dutch | 100.0 /100 | #10 | Exceptional 1.4% |
| Lithuanians | 100.0 /100 | #11 | Exceptional 1.4% |
| Irish | 100.0 /100 | #12 | Exceptional 1.4% |
| Poles | 100.0 /100 | #13 | Exceptional 1.4% |
| Scotch-Irish | 100.0 /100 | #14 | Exceptional 1.5% |
| Tlingit-Haida | 100.0 /100 | #15 | Exceptional 1.5% |