Sudanese vs Slovene No Schooling Completed
COMPARE
Sudanese
Slovene
No Schooling Completed
No Schooling Completed Comparison
Sudanese
Slovenes
2.3%
NO SCHOOLING COMPLETED
4.1/ 100
METRIC RATING
225th/ 347
METRIC RANK
1.4%
NO SCHOOLING COMPLETED
100.0/ 100
METRIC RATING
5th/ 347
METRIC RANK
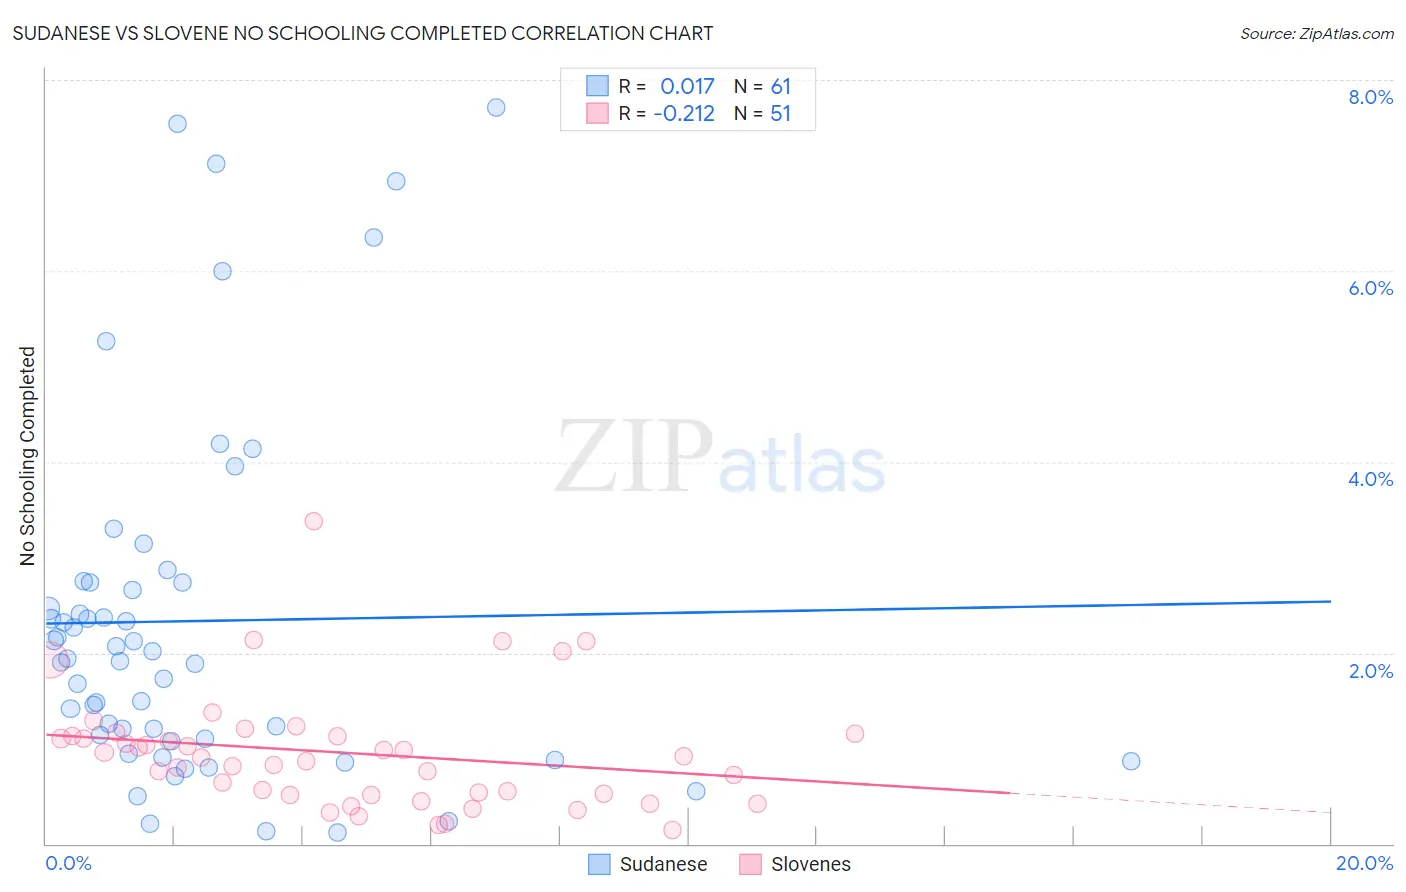
Sudanese vs Slovene No Schooling Completed Correlation Chart
The statistical analysis conducted on geographies consisting of 109,854,543 people shows no correlation between the proportion of Sudanese and percentage of population with no schooling in the United States with a correlation coefficient (R) of 0.017 and weighted average of 2.3%. Similarly, the statistical analysis conducted on geographies consisting of 258,600,541 people shows a weak negative correlation between the proportion of Slovenes and percentage of population with no schooling in the United States with a correlation coefficient (R) of -0.212 and weighted average of 1.4%, a difference of 69.8%.
No Schooling Completed Correlation Summary
| Measurement | Sudanese | Slovene |
| Minimum | 0.12% | 0.14% |
| Maximum | 7.7% | 3.4% |
| Range | 7.6% | 3.2% |
| Mean | 2.3% | 0.95% |
| Median | 1.9% | 0.91% |
| Interquartile 25% (IQ1) | 1.1% | 0.51% |
| Interquartile 75% (IQ3) | 2.7% | 1.1% |
| Interquartile Range (IQR) | 1.6% | 0.62% |
| Standard Deviation (Sample) | 1.9% | 0.61% |
| Standard Deviation (Population) | 1.8% | 0.60% |
Similar Demographics by No Schooling Completed
Demographics Similar to Sudanese by No Schooling Completed
In terms of no schooling completed, the demographic groups most similar to Sudanese are Tohono O'odham (2.3%, a difference of 0.0%), Sierra Leonean (2.3%, a difference of 0.010%), Immigrants from Uganda (2.3%, a difference of 0.070%), Immigrants from Lebanon (2.3%, a difference of 0.29%), and U.S. Virgin Islander (2.3%, a difference of 0.36%).
| Demographics | Rating | Rank | No Schooling Completed |
| Immigrants | Nepal | 6.4 /100 | #218 | Tragic 2.3% |
| Senegalese | 5.6 /100 | #219 | Tragic 2.3% |
| Immigrants | Costa Rica | 5.1 /100 | #220 | Tragic 2.3% |
| Immigrants | Sudan | 5.0 /100 | #221 | Tragic 2.3% |
| Sub-Saharan Africans | 4.7 /100 | #222 | Tragic 2.3% |
| Immigrants | Lebanon | 4.5 /100 | #223 | Tragic 2.3% |
| Tohono O'odham | 4.1 /100 | #224 | Tragic 2.3% |
| Sudanese | 4.1 /100 | #225 | Tragic 2.3% |
| Sierra Leoneans | 4.1 /100 | #226 | Tragic 2.3% |
| Immigrants | Uganda | 4.0 /100 | #227 | Tragic 2.3% |
| U.S. Virgin Islanders | 3.7 /100 | #228 | Tragic 2.3% |
| Immigrants | Pakistan | 3.6 /100 | #229 | Tragic 2.3% |
| Puerto Ricans | 3.4 /100 | #230 | Tragic 2.3% |
| Immigrants | Uruguay | 3.4 /100 | #231 | Tragic 2.3% |
| Colombians | 3.2 /100 | #232 | Tragic 2.3% |
Demographics Similar to Slovenes by No Schooling Completed
In terms of no schooling completed, the demographic groups most similar to Slovenes are German (1.4%, a difference of 0.42%), Carpatho Rusyn (1.4%, a difference of 0.82%), Norwegian (1.3%, a difference of 0.98%), Slovak (1.3%, a difference of 1.4%), and English (1.4%, a difference of 1.8%).
| Demographics | Rating | Rank | No Schooling Completed |
| Yup'ik | 100.0 /100 | #1 | Exceptional 1.2% |
| Slovaks | 100.0 /100 | #2 | Exceptional 1.3% |
| Norwegians | 100.0 /100 | #3 | Exceptional 1.3% |
| Germans | 100.0 /100 | #4 | Exceptional 1.4% |
| Slovenes | 100.0 /100 | #5 | Exceptional 1.4% |
| Carpatho Rusyns | 100.0 /100 | #6 | Exceptional 1.4% |
| English | 100.0 /100 | #7 | Exceptional 1.4% |
| Swedes | 100.0 /100 | #8 | Exceptional 1.4% |
| Scottish | 100.0 /100 | #9 | Exceptional 1.4% |
| Dutch | 100.0 /100 | #10 | Exceptional 1.4% |
| Lithuanians | 100.0 /100 | #11 | Exceptional 1.4% |
| Irish | 100.0 /100 | #12 | Exceptional 1.4% |
| Poles | 100.0 /100 | #13 | Exceptional 1.4% |
| Scotch-Irish | 100.0 /100 | #14 | Exceptional 1.5% |
| Tlingit-Haida | 100.0 /100 | #15 | Exceptional 1.5% |