Immigrants from Laos vs Slovene No Schooling Completed
COMPARE
Immigrants from Laos
Slovene
No Schooling Completed
No Schooling Completed Comparison
Immigrants from Laos
Slovenes
3.1%
NO SCHOOLING COMPLETED
0.0/ 100
METRIC RATING
321st/ 347
METRIC RANK
1.4%
NO SCHOOLING COMPLETED
100.0/ 100
METRIC RATING
5th/ 347
METRIC RANK
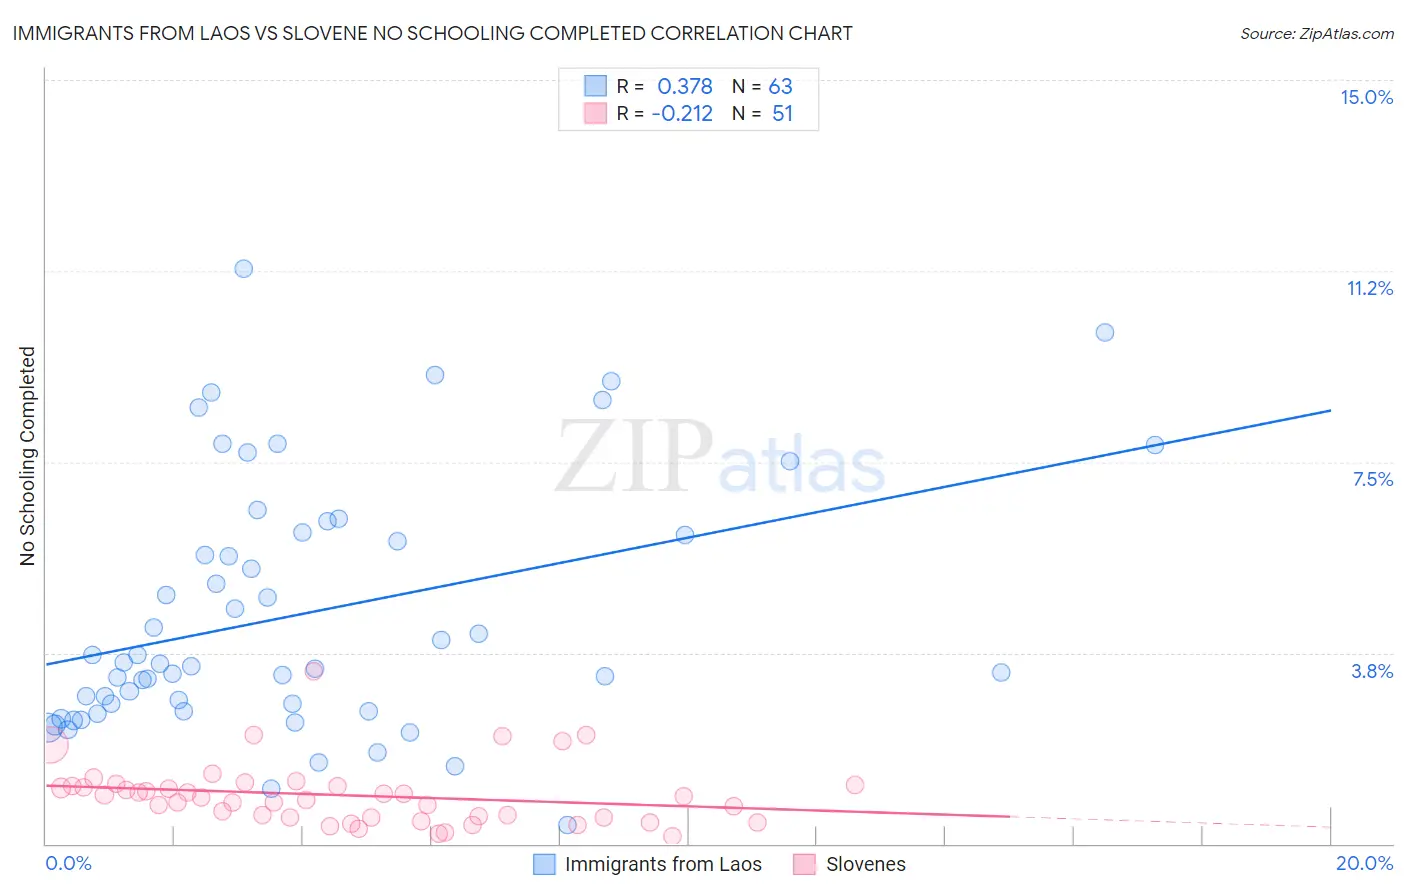
Immigrants from Laos vs Slovene No Schooling Completed Correlation Chart
The statistical analysis conducted on geographies consisting of 200,828,935 people shows a mild positive correlation between the proportion of Immigrants from Laos and percentage of population with no schooling in the United States with a correlation coefficient (R) of 0.378 and weighted average of 3.1%. Similarly, the statistical analysis conducted on geographies consisting of 258,600,541 people shows a weak negative correlation between the proportion of Slovenes and percentage of population with no schooling in the United States with a correlation coefficient (R) of -0.212 and weighted average of 1.4%, a difference of 131.3%.
No Schooling Completed Correlation Summary
| Measurement | Immigrants from Laos | Slovene |
| Minimum | 0.36% | 0.14% |
| Maximum | 11.3% | 3.4% |
| Range | 10.9% | 3.2% |
| Mean | 4.5% | 0.95% |
| Median | 3.5% | 0.91% |
| Interquartile 25% (IQ1) | 2.6% | 0.51% |
| Interquartile 75% (IQ3) | 6.1% | 1.1% |
| Interquartile Range (IQR) | 3.5% | 0.62% |
| Standard Deviation (Sample) | 2.5% | 0.61% |
| Standard Deviation (Population) | 2.5% | 0.60% |
Similar Demographics by No Schooling Completed
Demographics Similar to Immigrants from Laos by No Schooling Completed
In terms of no schooling completed, the demographic groups most similar to Immigrants from Laos are Immigrants from Bangladesh (3.1%, a difference of 0.11%), Immigrants from Burma/Myanmar (3.1%, a difference of 0.15%), Immigrants from Honduras (3.2%, a difference of 0.67%), Vietnamese (3.2%, a difference of 0.86%), and Immigrants from Guyana (3.1%, a difference of 0.89%).
| Demographics | Rating | Rank | No Schooling Completed |
| Immigrants | Belize | 0.0 /100 | #314 | Tragic 3.1% |
| Immigrants | Nicaragua | 0.0 /100 | #315 | Tragic 3.1% |
| Immigrants | Ecuador | 0.0 /100 | #316 | Tragic 3.1% |
| Cape Verdeans | 0.0 /100 | #317 | Tragic 3.1% |
| Immigrants | Guyana | 0.0 /100 | #318 | Tragic 3.1% |
| Immigrants | Burma/Myanmar | 0.0 /100 | #319 | Tragic 3.1% |
| Immigrants | Bangladesh | 0.0 /100 | #320 | Tragic 3.1% |
| Immigrants | Laos | 0.0 /100 | #321 | Tragic 3.1% |
| Immigrants | Honduras | 0.0 /100 | #322 | Tragic 3.2% |
| Vietnamese | 0.0 /100 | #323 | Tragic 3.2% |
| Mexican American Indians | 0.0 /100 | #324 | Tragic 3.2% |
| Dominicans | 0.0 /100 | #325 | Tragic 3.2% |
| Indonesians | 0.0 /100 | #326 | Tragic 3.2% |
| Immigrants | Latin America | 0.0 /100 | #327 | Tragic 3.3% |
| Mexicans | 0.0 /100 | #328 | Tragic 3.3% |
Demographics Similar to Slovenes by No Schooling Completed
In terms of no schooling completed, the demographic groups most similar to Slovenes are German (1.4%, a difference of 0.42%), Carpatho Rusyn (1.4%, a difference of 0.82%), Norwegian (1.3%, a difference of 0.98%), Slovak (1.3%, a difference of 1.4%), and English (1.4%, a difference of 1.8%).
| Demographics | Rating | Rank | No Schooling Completed |
| Yup'ik | 100.0 /100 | #1 | Exceptional 1.2% |
| Slovaks | 100.0 /100 | #2 | Exceptional 1.3% |
| Norwegians | 100.0 /100 | #3 | Exceptional 1.3% |
| Germans | 100.0 /100 | #4 | Exceptional 1.4% |
| Slovenes | 100.0 /100 | #5 | Exceptional 1.4% |
| Carpatho Rusyns | 100.0 /100 | #6 | Exceptional 1.4% |
| English | 100.0 /100 | #7 | Exceptional 1.4% |
| Swedes | 100.0 /100 | #8 | Exceptional 1.4% |
| Scottish | 100.0 /100 | #9 | Exceptional 1.4% |
| Dutch | 100.0 /100 | #10 | Exceptional 1.4% |
| Lithuanians | 100.0 /100 | #11 | Exceptional 1.4% |
| Irish | 100.0 /100 | #12 | Exceptional 1.4% |
| Poles | 100.0 /100 | #13 | Exceptional 1.4% |
| Scotch-Irish | 100.0 /100 | #14 | Exceptional 1.5% |
| Tlingit-Haida | 100.0 /100 | #15 | Exceptional 1.5% |