Lithuanian vs Immigrants from Oceania College, Under 1 year
COMPARE
Lithuanian
Immigrants from Oceania
College, Under 1 year
College, Under 1 year Comparison
Lithuanians
Immigrants from Oceania
68.8%
COLLEGE, UNDER 1 YEAR
99.1/ 100
METRIC RATING
70th/ 347
METRIC RANK
65.6%
COLLEGE, UNDER 1 YEAR
55.0/ 100
METRIC RATING
171st/ 347
METRIC RANK
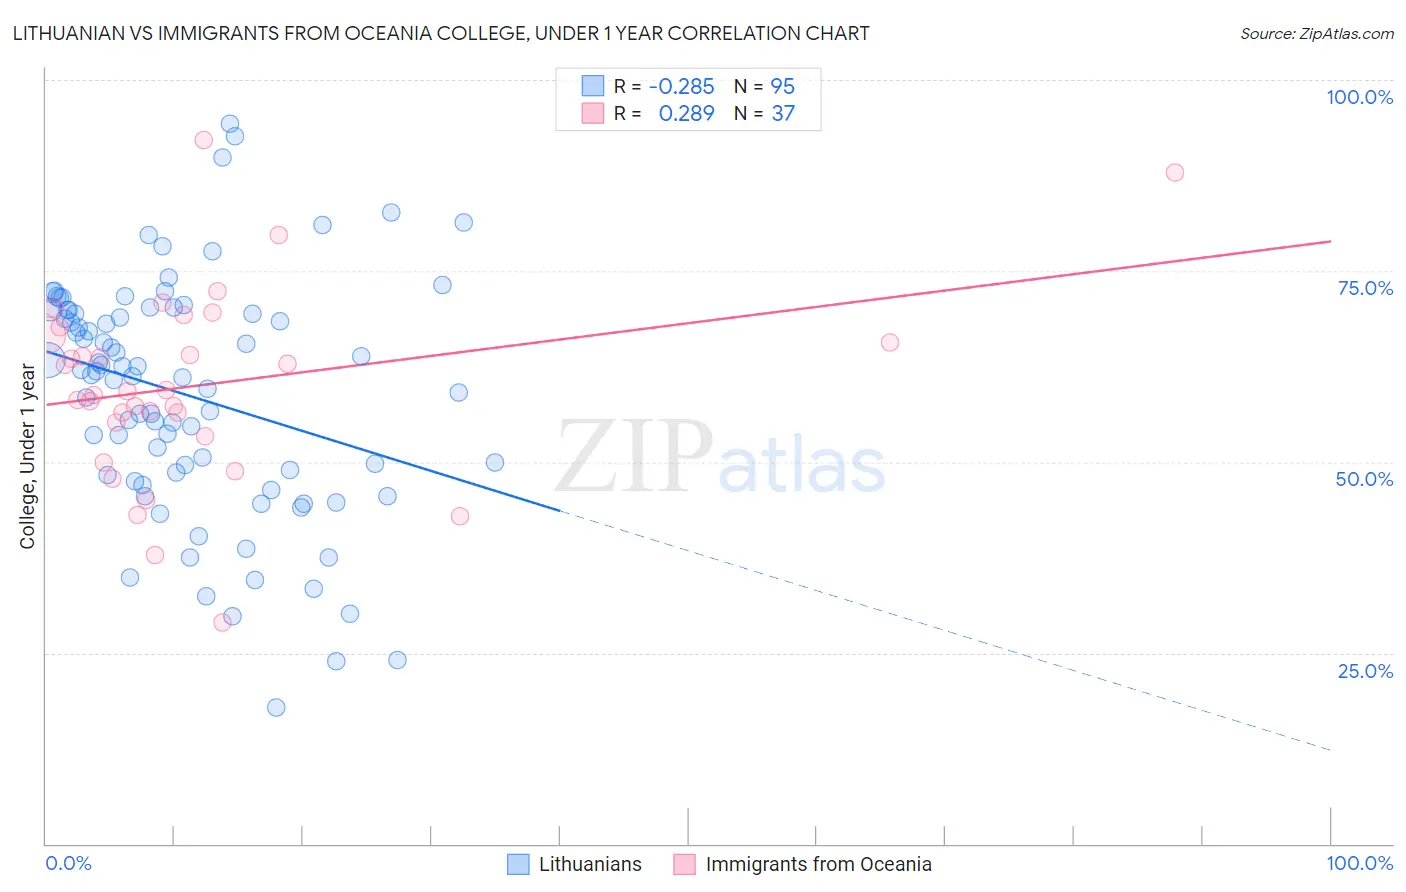
Lithuanian vs Immigrants from Oceania College, Under 1 year Correlation Chart
The statistical analysis conducted on geographies consisting of 421,945,677 people shows a weak negative correlation between the proportion of Lithuanians and percentage of population with at least college, under 1 year education in the United States with a correlation coefficient (R) of -0.285 and weighted average of 68.8%. Similarly, the statistical analysis conducted on geographies consisting of 305,519,500 people shows a weak positive correlation between the proportion of Immigrants from Oceania and percentage of population with at least college, under 1 year education in the United States with a correlation coefficient (R) of 0.289 and weighted average of 65.6%, a difference of 4.9%.
College, Under 1 year Correlation Summary
| Measurement | Lithuanian | Immigrants from Oceania |
| Minimum | 17.9% | 28.9% |
| Maximum | 94.2% | 92.2% |
| Range | 76.4% | 63.2% |
| Mean | 58.7% | 60.1% |
| Median | 61.4% | 59.2% |
| Interquartile 25% (IQ1) | 48.2% | 54.3% |
| Interquartile 75% (IQ3) | 69.9% | 67.1% |
| Interquartile Range (IQR) | 21.6% | 12.8% |
| Standard Deviation (Sample) | 15.4% | 12.6% |
| Standard Deviation (Population) | 15.4% | 12.4% |
Similar Demographics by College, Under 1 year
Demographics Similar to Lithuanians by College, Under 1 year
In terms of college, under 1 year, the demographic groups most similar to Lithuanians are Immigrants from Europe (68.8%, a difference of 0.010%), Bolivian (68.7%, a difference of 0.060%), Immigrants from England (68.7%, a difference of 0.090%), Swedish (68.7%, a difference of 0.15%), and Immigrants from Romania (68.9%, a difference of 0.16%).
| Demographics | Rating | Rank | College, Under 1 year |
| Immigrants | Canada | 99.4 /100 | #63 | Exceptional 69.1% |
| Northern Europeans | 99.4 /100 | #64 | Exceptional 69.0% |
| Immigrants | Moldova | 99.3 /100 | #65 | Exceptional 69.0% |
| Immigrants | North America | 99.3 /100 | #66 | Exceptional 69.0% |
| Immigrants | Zimbabwe | 99.2 /100 | #67 | Exceptional 68.9% |
| Immigrants | Indonesia | 99.2 /100 | #68 | Exceptional 68.9% |
| Immigrants | Romania | 99.2 /100 | #69 | Exceptional 68.9% |
| Lithuanians | 99.1 /100 | #70 | Exceptional 68.8% |
| Immigrants | Europe | 99.1 /100 | #71 | Exceptional 68.8% |
| Bolivians | 99.0 /100 | #72 | Exceptional 68.7% |
| Immigrants | England | 99.0 /100 | #73 | Exceptional 68.7% |
| Swedes | 98.9 /100 | #74 | Exceptional 68.7% |
| Immigrants | Western Europe | 98.6 /100 | #75 | Exceptional 68.5% |
| Laotians | 98.6 /100 | #76 | Exceptional 68.5% |
| British | 98.6 /100 | #77 | Exceptional 68.5% |
Demographics Similar to Immigrants from Oceania by College, Under 1 year
In terms of college, under 1 year, the demographic groups most similar to Immigrants from Oceania are Yugoslavian (65.6%, a difference of 0.030%), German (65.6%, a difference of 0.030%), South American Indian (65.5%, a difference of 0.030%), Hungarian (65.6%, a difference of 0.040%), and Swiss (65.5%, a difference of 0.050%).
| Demographics | Rating | Rank | College, Under 1 year |
| Czechoslovakians | 62.6 /100 | #164 | Good 65.8% |
| Immigrants | Uzbekistan | 61.6 /100 | #165 | Good 65.8% |
| Moroccans | 56.7 /100 | #166 | Average 65.6% |
| Immigrants | Somalia | 56.4 /100 | #167 | Average 65.6% |
| Hungarians | 55.9 /100 | #168 | Average 65.6% |
| Yugoslavians | 55.7 /100 | #169 | Average 65.6% |
| Germans | 55.7 /100 | #170 | Average 65.6% |
| Immigrants | Oceania | 55.0 /100 | #171 | Average 65.6% |
| South American Indians | 54.4 /100 | #172 | Average 65.5% |
| Swiss | 53.9 /100 | #173 | Average 65.5% |
| Immigrants | Bosnia and Herzegovina | 50.0 /100 | #174 | Average 65.4% |
| Scotch-Irish | 49.5 /100 | #175 | Average 65.4% |
| French | 48.9 /100 | #176 | Average 65.4% |
| Immigrants | North Macedonia | 48.6 /100 | #177 | Average 65.4% |
| German Russians | 48.3 /100 | #178 | Average 65.4% |