Immigrants from Northern Europe vs Immigrants from Sudan College, Under 1 year
COMPARE
Immigrants from Northern Europe
Immigrants from Sudan
College, Under 1 year
College, Under 1 year Comparison
Immigrants from Northern Europe
Immigrants from Sudan
71.1%
COLLEGE, UNDER 1 YEAR
100.0/ 100
METRIC RATING
23rd/ 347
METRIC RANK
66.2%
COLLEGE, UNDER 1 YEAR
76.0/ 100
METRIC RATING
151st/ 347
METRIC RANK
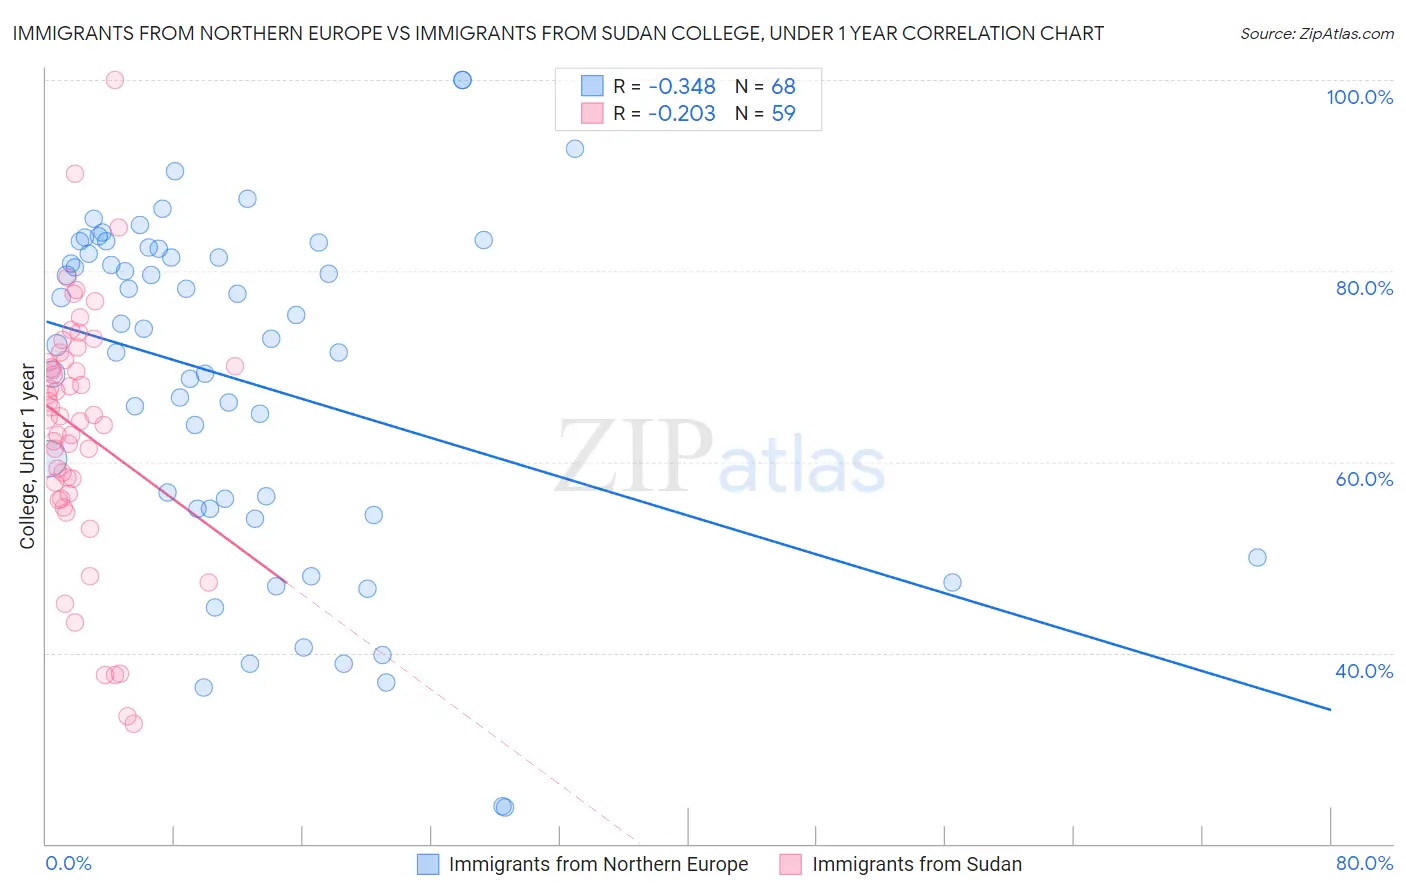
Immigrants from Northern Europe vs Immigrants from Sudan College, Under 1 year Correlation Chart
The statistical analysis conducted on geographies consisting of 477,223,087 people shows a mild negative correlation between the proportion of Immigrants from Northern Europe and percentage of population with at least college, under 1 year education in the United States with a correlation coefficient (R) of -0.348 and weighted average of 71.1%. Similarly, the statistical analysis conducted on geographies consisting of 118,973,526 people shows a weak negative correlation between the proportion of Immigrants from Sudan and percentage of population with at least college, under 1 year education in the United States with a correlation coefficient (R) of -0.203 and weighted average of 66.2%, a difference of 7.3%.
College, Under 1 year Correlation Summary
| Measurement | Immigrants from Northern Europe | Immigrants from Sudan |
| Minimum | 23.8% | 32.5% |
| Maximum | 100.0% | 100.0% |
| Range | 76.2% | 67.5% |
| Mean | 68.4% | 63.4% |
| Median | 73.4% | 64.8% |
| Interquartile 25% (IQ1) | 55.1% | 56.6% |
| Interquartile 75% (IQ3) | 82.0% | 70.7% |
| Interquartile Range (IQR) | 26.9% | 14.1% |
| Standard Deviation (Sample) | 18.0% | 13.2% |
| Standard Deviation (Population) | 17.8% | 13.0% |
Similar Demographics by College, Under 1 year
Demographics Similar to Immigrants from Northern Europe by College, Under 1 year
In terms of college, under 1 year, the demographic groups most similar to Immigrants from Northern Europe are Soviet Union (71.1%, a difference of 0.010%), Bulgarian (71.1%, a difference of 0.030%), Immigrants from Denmark (71.0%, a difference of 0.14%), Immigrants from Ireland (71.0%, a difference of 0.15%), and Immigrants from Hong Kong (71.0%, a difference of 0.18%).
| Demographics | Rating | Rank | College, Under 1 year |
| Immigrants | Japan | 100.0 /100 | #16 | Exceptional 71.9% |
| Eastern Europeans | 100.0 /100 | #17 | Exceptional 71.8% |
| Immigrants | Switzerland | 100.0 /100 | #18 | Exceptional 71.7% |
| Latvians | 100.0 /100 | #19 | Exceptional 71.6% |
| Immigrants | Korea | 100.0 /100 | #20 | Exceptional 71.6% |
| Immigrants | Belgium | 100.0 /100 | #21 | Exceptional 71.5% |
| Immigrants | Eastern Asia | 100.0 /100 | #22 | Exceptional 71.3% |
| Immigrants | Northern Europe | 100.0 /100 | #23 | Exceptional 71.1% |
| Soviet Union | 100.0 /100 | #24 | Exceptional 71.1% |
| Bulgarians | 100.0 /100 | #25 | Exceptional 71.1% |
| Immigrants | Denmark | 100.0 /100 | #26 | Exceptional 71.0% |
| Immigrants | Ireland | 100.0 /100 | #27 | Exceptional 71.0% |
| Immigrants | Hong Kong | 100.0 /100 | #28 | Exceptional 71.0% |
| Immigrants | France | 100.0 /100 | #29 | Exceptional 71.0% |
| Immigrants | China | 99.9 /100 | #30 | Exceptional 70.9% |
Demographics Similar to Immigrants from Sudan by College, Under 1 year
In terms of college, under 1 year, the demographic groups most similar to Immigrants from Sudan are Immigrants from Iraq (66.3%, a difference of 0.070%), Sudanese (66.2%, a difference of 0.11%), Immigrants from Venezuela (66.3%, a difference of 0.12%), Belgian (66.2%, a difference of 0.13%), and Taiwanese (66.4%, a difference of 0.16%).
| Demographics | Rating | Rank | College, Under 1 year |
| Immigrants | Germany | 82.0 /100 | #144 | Excellent 66.5% |
| Immigrants | Kenya | 81.8 /100 | #145 | Excellent 66.5% |
| Kenyans | 81.7 /100 | #146 | Excellent 66.5% |
| Immigrants | Morocco | 81.7 /100 | #147 | Excellent 66.5% |
| Taiwanese | 78.6 /100 | #148 | Good 66.4% |
| Immigrants | Venezuela | 77.9 /100 | #149 | Good 66.3% |
| Immigrants | Iraq | 77.1 /100 | #150 | Good 66.3% |
| Immigrants | Sudan | 76.0 /100 | #151 | Good 66.2% |
| Sudanese | 74.1 /100 | #152 | Good 66.2% |
| Belgians | 73.7 /100 | #153 | Good 66.2% |
| Immigrants | Eritrea | 71.9 /100 | #154 | Good 66.1% |
| Irish | 70.3 /100 | #155 | Good 66.0% |
| Welsh | 69.9 /100 | #156 | Good 66.0% |
| Sierra Leoneans | 67.8 /100 | #157 | Good 66.0% |
| Celtics | 67.3 /100 | #158 | Good 65.9% |