Lithuanian vs Immigrants from Spain College, Under 1 year
COMPARE
Lithuanian
Immigrants from Spain
College, Under 1 year
College, Under 1 year Comparison
Lithuanians
Immigrants from Spain
68.8%
COLLEGE, UNDER 1 YEAR
99.1/ 100
METRIC RATING
70th/ 347
METRIC RANK
68.4%
COLLEGE, UNDER 1 YEAR
98.5/ 100
METRIC RATING
80th/ 347
METRIC RANK
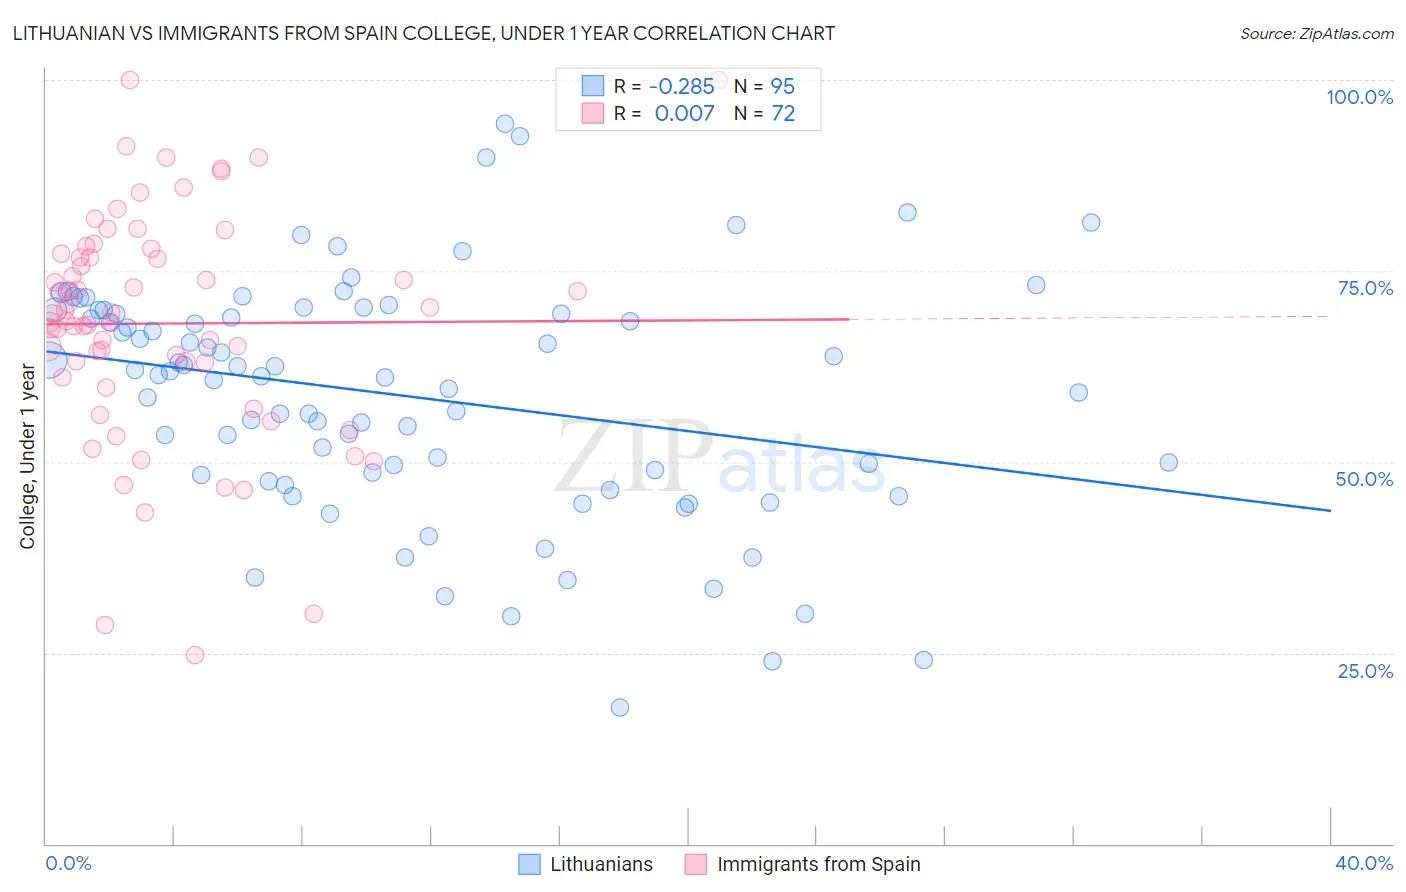
Lithuanian vs Immigrants from Spain College, Under 1 year Correlation Chart
The statistical analysis conducted on geographies consisting of 421,945,677 people shows a weak negative correlation between the proportion of Lithuanians and percentage of population with at least college, under 1 year education in the United States with a correlation coefficient (R) of -0.285 and weighted average of 68.8%. Similarly, the statistical analysis conducted on geographies consisting of 239,683,397 people shows no correlation between the proportion of Immigrants from Spain and percentage of population with at least college, under 1 year education in the United States with a correlation coefficient (R) of 0.007 and weighted average of 68.4%, a difference of 0.49%.
College, Under 1 year Correlation Summary
| Measurement | Lithuanian | Immigrants from Spain |
| Minimum | 17.9% | 24.8% |
| Maximum | 94.2% | 100.0% |
| Range | 76.4% | 75.2% |
| Mean | 58.7% | 68.1% |
| Median | 61.4% | 68.9% |
| Interquartile 25% (IQ1) | 48.2% | 62.0% |
| Interquartile 75% (IQ3) | 69.9% | 77.0% |
| Interquartile Range (IQR) | 21.6% | 15.0% |
| Standard Deviation (Sample) | 15.4% | 15.0% |
| Standard Deviation (Population) | 15.4% | 14.9% |
Demographics Similar to Lithuanians and Immigrants from Spain by College, Under 1 year
In terms of college, under 1 year, the demographic groups most similar to Lithuanians are Immigrants from Europe (68.8%, a difference of 0.010%), Bolivian (68.7%, a difference of 0.060%), Immigrants from England (68.7%, a difference of 0.090%), Swedish (68.7%, a difference of 0.15%), and Immigrants from Romania (68.9%, a difference of 0.16%). Similarly, the demographic groups most similar to Immigrants from Spain are Greek (68.5%, a difference of 0.030%), Danish (68.5%, a difference of 0.040%), Immigrants from Greece (68.4%, a difference of 0.040%), British (68.5%, a difference of 0.050%), and Immigrants from Western Europe (68.5%, a difference of 0.090%).
| Demographics | Rating | Rank | College, Under 1 year |
| Immigrants | Moldova | 99.3 /100 | #65 | Exceptional 69.0% |
| Immigrants | North America | 99.3 /100 | #66 | Exceptional 69.0% |
| Immigrants | Zimbabwe | 99.2 /100 | #67 | Exceptional 68.9% |
| Immigrants | Indonesia | 99.2 /100 | #68 | Exceptional 68.9% |
| Immigrants | Romania | 99.2 /100 | #69 | Exceptional 68.9% |
| Lithuanians | 99.1 /100 | #70 | Exceptional 68.8% |
| Immigrants | Europe | 99.1 /100 | #71 | Exceptional 68.8% |
| Bolivians | 99.0 /100 | #72 | Exceptional 68.7% |
| Immigrants | England | 99.0 /100 | #73 | Exceptional 68.7% |
| Swedes | 98.9 /100 | #74 | Exceptional 68.7% |
| Immigrants | Western Europe | 98.6 /100 | #75 | Exceptional 68.5% |
| Laotians | 98.6 /100 | #76 | Exceptional 68.5% |
| British | 98.6 /100 | #77 | Exceptional 68.5% |
| Danes | 98.6 /100 | #78 | Exceptional 68.5% |
| Greeks | 98.6 /100 | #79 | Exceptional 68.5% |
| Immigrants | Spain | 98.5 /100 | #80 | Exceptional 68.4% |
| Immigrants | Greece | 98.5 /100 | #81 | Exceptional 68.4% |
| Norwegians | 98.4 /100 | #82 | Exceptional 68.4% |
| Argentineans | 98.4 /100 | #83 | Exceptional 68.4% |
| Immigrants | Hungary | 98.3 /100 | #84 | Exceptional 68.3% |
| Egyptians | 98.3 /100 | #85 | Exceptional 68.3% |