Lithuanian vs British High School Diploma
COMPARE
Lithuanian
British
High School Diploma
High School Diploma Comparison
Lithuanians
British
92.0%
HIGH SCHOOL DIPLOMA
100.0/ 100
METRIC RATING
4th/ 347
METRIC RANK
91.3%
HIGH SCHOOL DIPLOMA
99.8/ 100
METRIC RATING
43rd/ 347
METRIC RANK
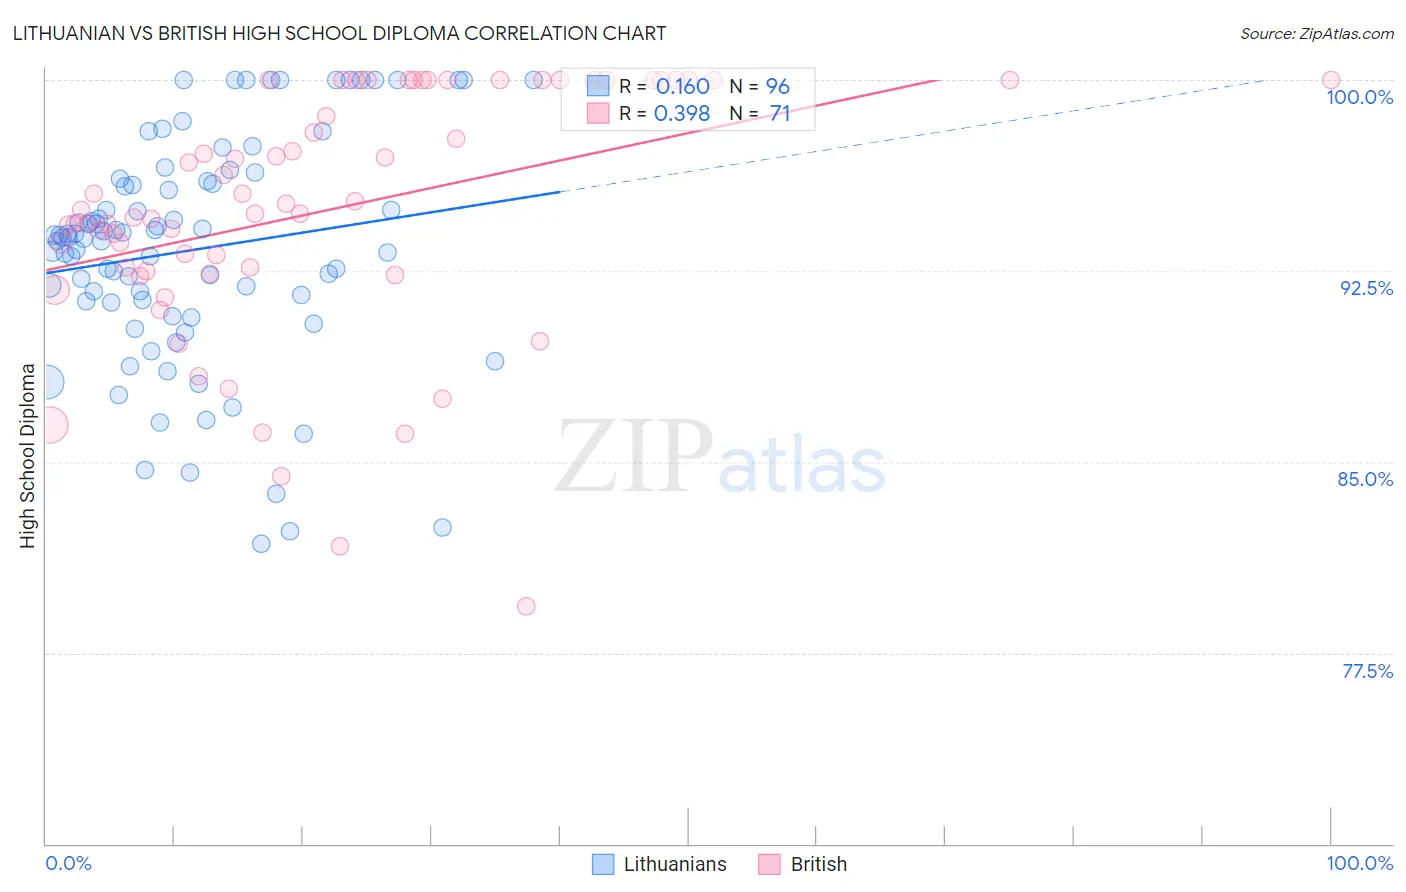
Lithuanian vs British High School Diploma Correlation Chart
The statistical analysis conducted on geographies consisting of 421,947,832 people shows a poor positive correlation between the proportion of Lithuanians and percentage of population with at least high school diploma education in the United States with a correlation coefficient (R) of 0.160 and weighted average of 92.0%. Similarly, the statistical analysis conducted on geographies consisting of 531,463,566 people shows a mild positive correlation between the proportion of British and percentage of population with at least high school diploma education in the United States with a correlation coefficient (R) of 0.398 and weighted average of 91.3%, a difference of 0.86%.
High School Diploma Correlation Summary
| Measurement | Lithuanian | British |
| Minimum | 81.8% | 79.3% |
| Maximum | 100.0% | 100.0% |
| Range | 18.2% | 20.7% |
| Mean | 93.3% | 94.9% |
| Median | 93.8% | 94.9% |
| Interquartile 25% (IQ1) | 91.3% | 92.5% |
| Interquartile 75% (IQ3) | 96.0% | 100.0% |
| Interquartile Range (IQR) | 4.7% | 7.5% |
| Standard Deviation (Sample) | 4.4% | 4.8% |
| Standard Deviation (Population) | 4.4% | 4.8% |
Similar Demographics by High School Diploma
Demographics Similar to Lithuanians by High School Diploma
In terms of high school diploma, the demographic groups most similar to Lithuanians are Slovene (92.0%, a difference of 0.0%), Slovak (92.0%, a difference of 0.030%), Immigrants from India (92.0%, a difference of 0.030%), Chinese (92.0%, a difference of 0.040%), and Latvian (92.0%, a difference of 0.050%).
| Demographics | Rating | Rank | High School Diploma |
| Norwegians | 100.0 /100 | #1 | Exceptional 92.5% |
| Swedes | 100.0 /100 | #2 | Exceptional 92.2% |
| Carpatho Rusyns | 100.0 /100 | #3 | Exceptional 92.1% |
| Lithuanians | 100.0 /100 | #4 | Exceptional 92.0% |
| Slovenes | 100.0 /100 | #5 | Exceptional 92.0% |
| Slovaks | 100.0 /100 | #6 | Exceptional 92.0% |
| Immigrants | India | 100.0 /100 | #7 | Exceptional 92.0% |
| Chinese | 100.0 /100 | #8 | Exceptional 92.0% |
| Latvians | 100.0 /100 | #9 | Exceptional 92.0% |
| Croatians | 100.0 /100 | #10 | Exceptional 92.0% |
| Eastern Europeans | 100.0 /100 | #11 | Exceptional 91.9% |
| Poles | 100.0 /100 | #12 | Exceptional 91.9% |
| Danes | 100.0 /100 | #13 | Exceptional 91.8% |
| Bulgarians | 100.0 /100 | #14 | Exceptional 91.8% |
| Luxembourgers | 100.0 /100 | #15 | Exceptional 91.7% |
Demographics Similar to British by High School Diploma
In terms of high school diploma, the demographic groups most similar to British are Immigrants from Australia (91.3%, a difference of 0.010%), Northern European (91.3%, a difference of 0.010%), Immigrants from Austria (91.3%, a difference of 0.010%), Turkish (91.2%, a difference of 0.020%), and Dutch (91.3%, a difference of 0.040%).
| Demographics | Rating | Rank | High School Diploma |
| Tsimshian | 99.9 /100 | #36 | Exceptional 91.3% |
| Immigrants | Ireland | 99.9 /100 | #37 | Exceptional 91.3% |
| Immigrants | Scotland | 99.8 /100 | #38 | Exceptional 91.3% |
| Dutch | 99.8 /100 | #39 | Exceptional 91.3% |
| Immigrants | Lithuania | 99.8 /100 | #40 | Exceptional 91.3% |
| Immigrants | Australia | 99.8 /100 | #41 | Exceptional 91.3% |
| Northern Europeans | 99.8 /100 | #42 | Exceptional 91.3% |
| British | 99.8 /100 | #43 | Exceptional 91.3% |
| Immigrants | Austria | 99.8 /100 | #44 | Exceptional 91.3% |
| Turks | 99.8 /100 | #45 | Exceptional 91.2% |
| Greeks | 99.8 /100 | #46 | Exceptional 91.2% |
| Australians | 99.8 /100 | #47 | Exceptional 91.2% |
| Belgians | 99.8 /100 | #48 | Exceptional 91.2% |
| Bhutanese | 99.8 /100 | #49 | Exceptional 91.2% |
| Welsh | 99.8 /100 | #50 | Exceptional 91.2% |