Lithuanian vs Immigrants from Taiwan High School Diploma
COMPARE
Lithuanian
Immigrants from Taiwan
High School Diploma
High School Diploma Comparison
Lithuanians
Immigrants from Taiwan
92.0%
HIGH SCHOOL DIPLOMA
100.0/ 100
METRIC RATING
4th/ 347
METRIC RANK
91.0%
HIGH SCHOOL DIPLOMA
99.6/ 100
METRIC RATING
61st/ 347
METRIC RANK
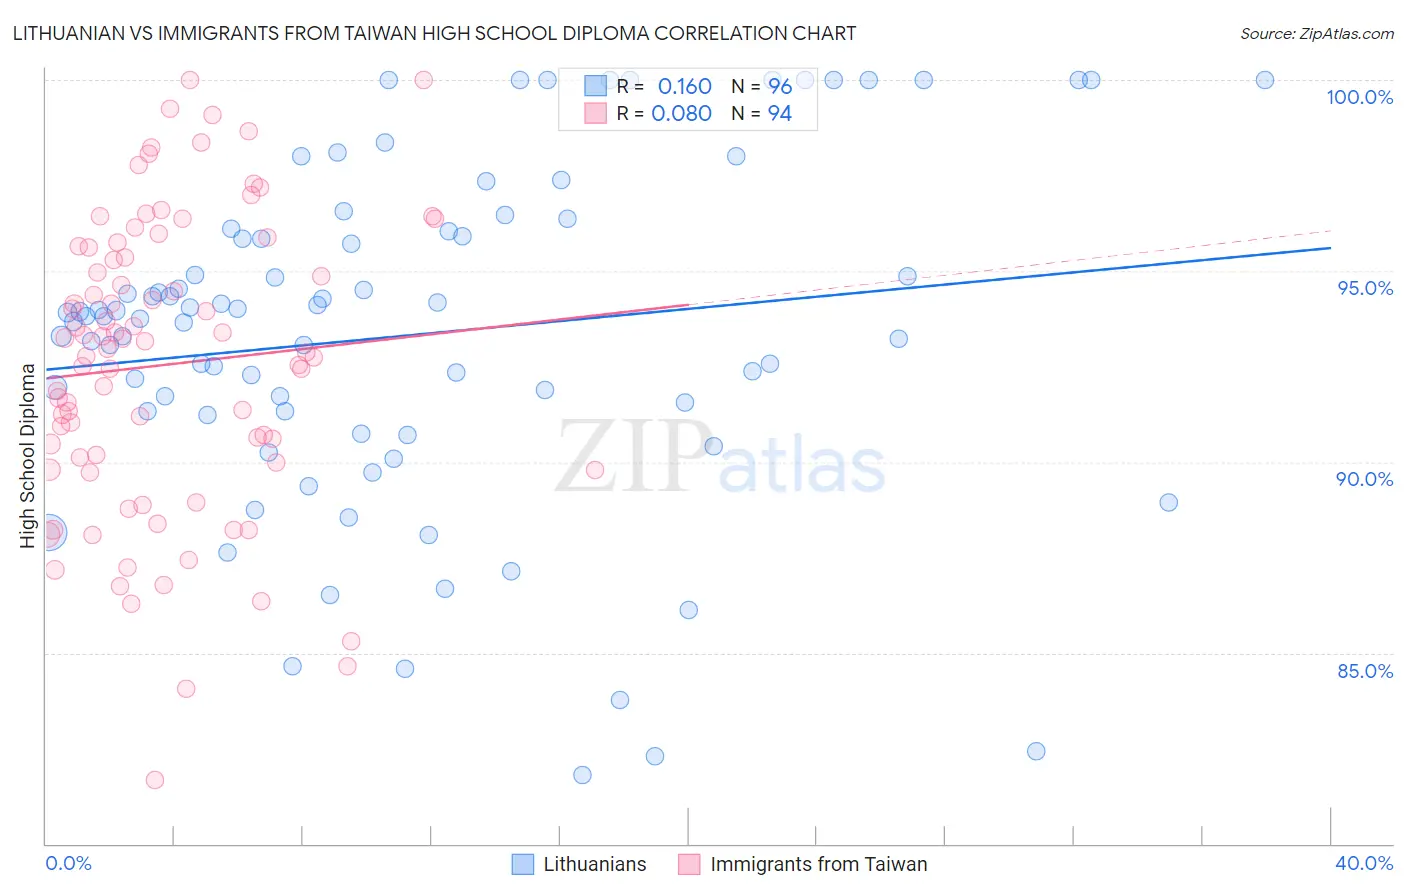
Lithuanian vs Immigrants from Taiwan High School Diploma Correlation Chart
The statistical analysis conducted on geographies consisting of 421,947,832 people shows a poor positive correlation between the proportion of Lithuanians and percentage of population with at least high school diploma education in the United States with a correlation coefficient (R) of 0.160 and weighted average of 92.0%. Similarly, the statistical analysis conducted on geographies consisting of 298,119,887 people shows a slight positive correlation between the proportion of Immigrants from Taiwan and percentage of population with at least high school diploma education in the United States with a correlation coefficient (R) of 0.080 and weighted average of 91.0%, a difference of 1.1%.
High School Diploma Correlation Summary
| Measurement | Lithuanian | Immigrants from Taiwan |
| Minimum | 81.8% | 81.7% |
| Maximum | 100.0% | 100.0% |
| Range | 18.2% | 18.3% |
| Mean | 93.3% | 92.5% |
| Median | 93.8% | 92.9% |
| Interquartile 25% (IQ1) | 91.3% | 90.0% |
| Interquartile 75% (IQ3) | 96.0% | 95.6% |
| Interquartile Range (IQR) | 4.7% | 5.6% |
| Standard Deviation (Sample) | 4.4% | 3.9% |
| Standard Deviation (Population) | 4.4% | 3.9% |
Similar Demographics by High School Diploma
Demographics Similar to Lithuanians by High School Diploma
In terms of high school diploma, the demographic groups most similar to Lithuanians are Slovene (92.0%, a difference of 0.0%), Slovak (92.0%, a difference of 0.030%), Immigrants from India (92.0%, a difference of 0.030%), Chinese (92.0%, a difference of 0.040%), and Latvian (92.0%, a difference of 0.050%).
| Demographics | Rating | Rank | High School Diploma |
| Norwegians | 100.0 /100 | #1 | Exceptional 92.5% |
| Swedes | 100.0 /100 | #2 | Exceptional 92.2% |
| Carpatho Rusyns | 100.0 /100 | #3 | Exceptional 92.1% |
| Lithuanians | 100.0 /100 | #4 | Exceptional 92.0% |
| Slovenes | 100.0 /100 | #5 | Exceptional 92.0% |
| Slovaks | 100.0 /100 | #6 | Exceptional 92.0% |
| Immigrants | India | 100.0 /100 | #7 | Exceptional 92.0% |
| Chinese | 100.0 /100 | #8 | Exceptional 92.0% |
| Latvians | 100.0 /100 | #9 | Exceptional 92.0% |
| Croatians | 100.0 /100 | #10 | Exceptional 92.0% |
| Eastern Europeans | 100.0 /100 | #11 | Exceptional 91.9% |
| Poles | 100.0 /100 | #12 | Exceptional 91.9% |
| Danes | 100.0 /100 | #13 | Exceptional 91.8% |
| Bulgarians | 100.0 /100 | #14 | Exceptional 91.8% |
| Luxembourgers | 100.0 /100 | #15 | Exceptional 91.7% |
Demographics Similar to Immigrants from Taiwan by High School Diploma
In terms of high school diploma, the demographic groups most similar to Immigrants from Taiwan are Immigrants from Japan (91.0%, a difference of 0.010%), Austrian (91.0%, a difference of 0.020%), Slavic (91.0%, a difference of 0.040%), Immigrants from North America (91.0%, a difference of 0.040%), and Zimbabwean (91.1%, a difference of 0.050%).
| Demographics | Rating | Rank | High School Diploma |
| Macedonians | 99.7 /100 | #54 | Exceptional 91.1% |
| Serbians | 99.7 /100 | #55 | Exceptional 91.1% |
| Immigrants | Canada | 99.7 /100 | #56 | Exceptional 91.1% |
| Zimbabweans | 99.7 /100 | #57 | Exceptional 91.1% |
| Slavs | 99.7 /100 | #58 | Exceptional 91.0% |
| Immigrants | North America | 99.7 /100 | #59 | Exceptional 91.0% |
| Immigrants | Japan | 99.6 /100 | #60 | Exceptional 91.0% |
| Immigrants | Taiwan | 99.6 /100 | #61 | Exceptional 91.0% |
| Austrians | 99.6 /100 | #62 | Exceptional 91.0% |
| Immigrants | Netherlands | 99.6 /100 | #63 | Exceptional 91.0% |
| Ukrainians | 99.6 /100 | #64 | Exceptional 91.0% |
| Immigrants | South Africa | 99.6 /100 | #65 | Exceptional 91.0% |
| French | 99.5 /100 | #66 | Exceptional 91.0% |
| Immigrants | Iran | 99.5 /100 | #67 | Exceptional 90.9% |
| Czechoslovakians | 99.5 /100 | #68 | Exceptional 90.9% |