Lithuanian vs Asian High School Diploma
COMPARE
Lithuanian
Asian
High School Diploma
High School Diploma Comparison
Lithuanians
Asians
92.0%
HIGH SCHOOL DIPLOMA
100.0/ 100
METRIC RATING
4th/ 347
METRIC RANK
89.4%
HIGH SCHOOL DIPLOMA
70.7/ 100
METRIC RATING
152nd/ 347
METRIC RANK
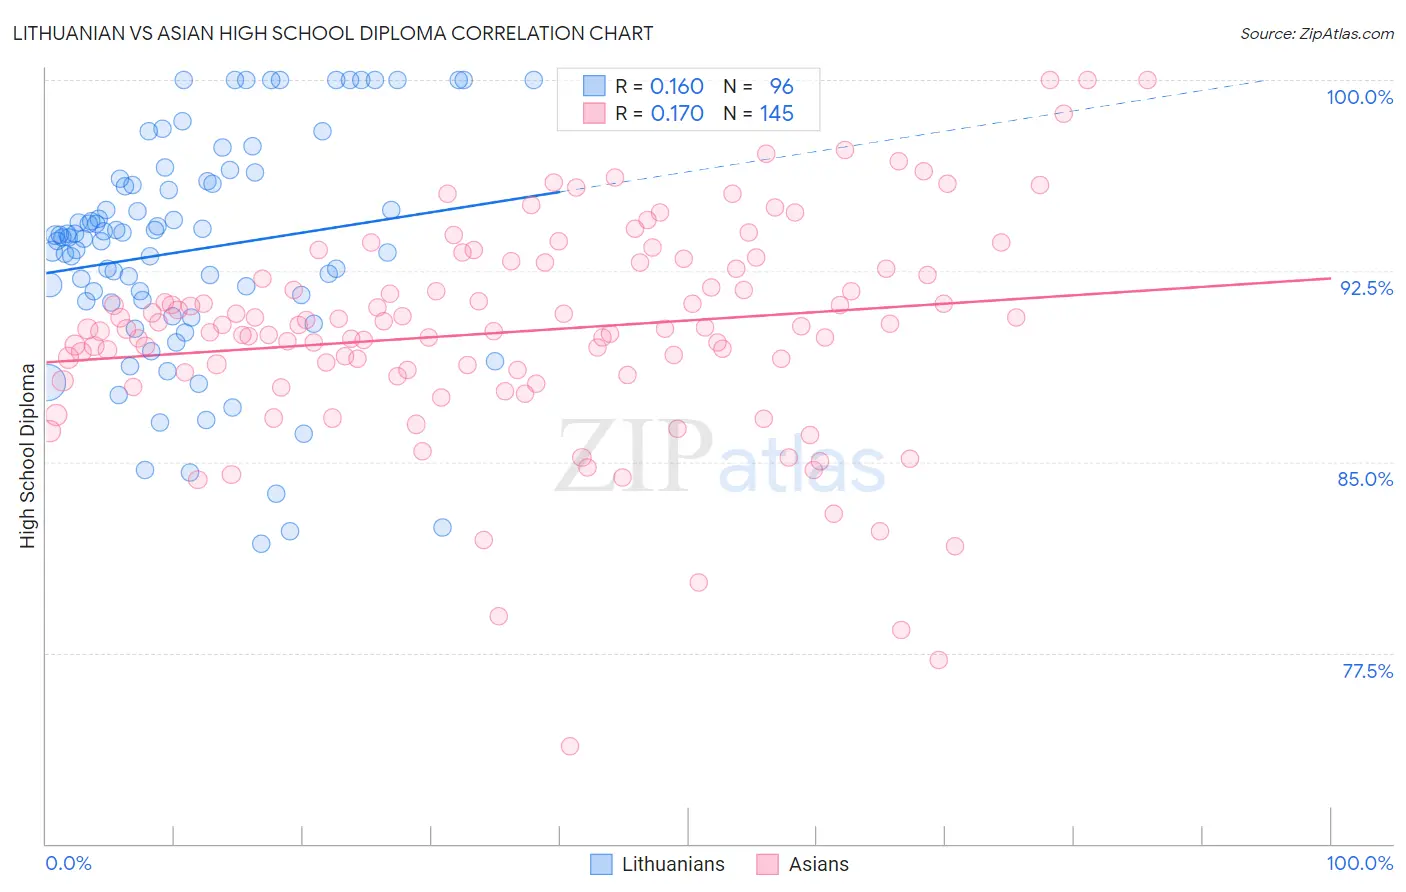
Lithuanian vs Asian High School Diploma Correlation Chart
The statistical analysis conducted on geographies consisting of 421,947,832 people shows a poor positive correlation between the proportion of Lithuanians and percentage of population with at least high school diploma education in the United States with a correlation coefficient (R) of 0.160 and weighted average of 92.0%. Similarly, the statistical analysis conducted on geographies consisting of 550,718,935 people shows a poor positive correlation between the proportion of Asians and percentage of population with at least high school diploma education in the United States with a correlation coefficient (R) of 0.170 and weighted average of 89.4%, a difference of 2.9%.
High School Diploma Correlation Summary
| Measurement | Lithuanian | Asian |
| Minimum | 81.8% | 73.8% |
| Maximum | 100.0% | 100.0% |
| Range | 18.2% | 26.2% |
| Mean | 93.3% | 90.1% |
| Median | 93.8% | 90.2% |
| Interquartile 25% (IQ1) | 91.3% | 88.5% |
| Interquartile 75% (IQ3) | 96.0% | 92.6% |
| Interquartile Range (IQR) | 4.7% | 4.1% |
| Standard Deviation (Sample) | 4.4% | 4.2% |
| Standard Deviation (Population) | 4.4% | 4.2% |
Similar Demographics by High School Diploma
Demographics Similar to Lithuanians by High School Diploma
In terms of high school diploma, the demographic groups most similar to Lithuanians are Slovene (92.0%, a difference of 0.0%), Slovak (92.0%, a difference of 0.030%), Immigrants from India (92.0%, a difference of 0.030%), Chinese (92.0%, a difference of 0.040%), and Latvian (92.0%, a difference of 0.050%).
| Demographics | Rating | Rank | High School Diploma |
| Norwegians | 100.0 /100 | #1 | Exceptional 92.5% |
| Swedes | 100.0 /100 | #2 | Exceptional 92.2% |
| Carpatho Rusyns | 100.0 /100 | #3 | Exceptional 92.1% |
| Lithuanians | 100.0 /100 | #4 | Exceptional 92.0% |
| Slovenes | 100.0 /100 | #5 | Exceptional 92.0% |
| Slovaks | 100.0 /100 | #6 | Exceptional 92.0% |
| Immigrants | India | 100.0 /100 | #7 | Exceptional 92.0% |
| Chinese | 100.0 /100 | #8 | Exceptional 92.0% |
| Latvians | 100.0 /100 | #9 | Exceptional 92.0% |
| Croatians | 100.0 /100 | #10 | Exceptional 92.0% |
| Eastern Europeans | 100.0 /100 | #11 | Exceptional 91.9% |
| Poles | 100.0 /100 | #12 | Exceptional 91.9% |
| Danes | 100.0 /100 | #13 | Exceptional 91.8% |
| Bulgarians | 100.0 /100 | #14 | Exceptional 91.8% |
| Luxembourgers | 100.0 /100 | #15 | Exceptional 91.7% |
Demographics Similar to Asians by High School Diploma
In terms of high school diploma, the demographic groups most similar to Asians are Paraguayan (89.5%, a difference of 0.010%), Argentinean (89.5%, a difference of 0.030%), Immigrants from Poland (89.5%, a difference of 0.040%), Immigrants from Iraq (89.4%, a difference of 0.040%), and Immigrants from Lebanon (89.5%, a difference of 0.050%).
| Demographics | Rating | Rank | High School Diploma |
| Immigrants | Brazil | 76.6 /100 | #145 | Good 89.5% |
| Immigrants | Spain | 76.2 /100 | #146 | Good 89.5% |
| Iraqis | 73.9 /100 | #147 | Good 89.5% |
| Immigrants | Lebanon | 73.4 /100 | #148 | Good 89.5% |
| Immigrants | Poland | 72.9 /100 | #149 | Good 89.5% |
| Argentineans | 72.3 /100 | #150 | Good 89.5% |
| Paraguayans | 71.4 /100 | #151 | Good 89.5% |
| Asians | 70.7 /100 | #152 | Good 89.4% |
| Immigrants | Iraq | 68.7 /100 | #153 | Good 89.4% |
| Alsatians | 66.8 /100 | #154 | Good 89.4% |
| Immigrants | Northern Africa | 66.4 /100 | #155 | Good 89.4% |
| Immigrants | Argentina | 65.5 /100 | #156 | Good 89.4% |
| Immigrants | Malaysia | 63.5 /100 | #157 | Good 89.3% |
| Immigrants | Pakistan | 62.5 /100 | #158 | Good 89.3% |
| Immigrants | China | 62.0 /100 | #159 | Good 89.3% |