Houma vs Immigrants from Guatemala No Schooling Completed
COMPARE
Houma
Immigrants from Guatemala
No Schooling Completed
No Schooling Completed Comparison
Houma
Immigrants from Guatemala
2.8%
NO SCHOOLING COMPLETED
0.0/ 100
METRIC RATING
295th/ 347
METRIC RANK
3.6%
NO SCHOOLING COMPLETED
0.0/ 100
METRIC RATING
340th/ 347
METRIC RANK
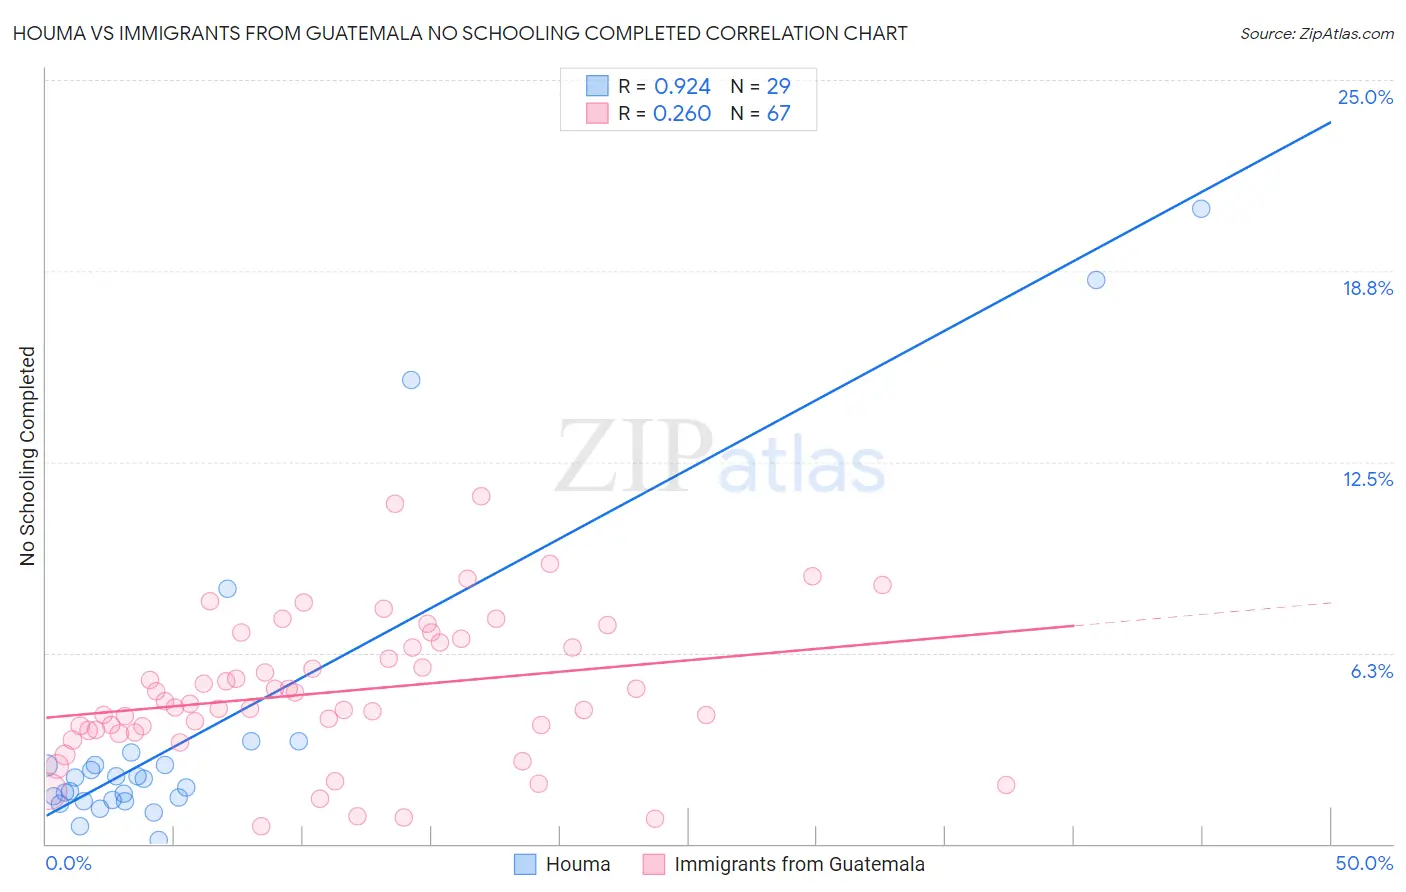
Houma vs Immigrants from Guatemala No Schooling Completed Correlation Chart
The statistical analysis conducted on geographies consisting of 36,712,306 people shows a near-perfect positive correlation between the proportion of Houma and percentage of population with no schooling in the United States with a correlation coefficient (R) of 0.924 and weighted average of 2.8%. Similarly, the statistical analysis conducted on geographies consisting of 375,195,495 people shows a weak positive correlation between the proportion of Immigrants from Guatemala and percentage of population with no schooling in the United States with a correlation coefficient (R) of 0.260 and weighted average of 3.6%, a difference of 28.4%.
No Schooling Completed Correlation Summary
| Measurement | Houma | Immigrants from Guatemala |
| Minimum | 0.12% | 0.58% |
| Maximum | 20.8% | 11.4% |
| Range | 20.7% | 10.8% |
| Mean | 3.8% | 5.0% |
| Median | 2.1% | 4.6% |
| Interquartile 25% (IQ1) | 1.4% | 3.7% |
| Interquartile 75% (IQ3) | 2.8% | 6.6% |
| Interquartile Range (IQR) | 1.4% | 2.9% |
| Standard Deviation (Sample) | 5.2% | 2.3% |
| Standard Deviation (Population) | 5.1% | 2.3% |
Similar Demographics by No Schooling Completed
Demographics Similar to Houma by No Schooling Completed
In terms of no schooling completed, the demographic groups most similar to Houma are Immigrants (2.8%, a difference of 0.10%), Immigrants from Eritrea (2.8%, a difference of 0.52%), Malaysian (2.8%, a difference of 0.69%), Immigrants from Grenada (2.8%, a difference of 1.1%), and Immigrants from Cuba (2.8%, a difference of 1.3%).
| Demographics | Rating | Rank | No Schooling Completed |
| Immigrants | St. Vincent and the Grenadines | 0.0 /100 | #288 | Tragic 2.7% |
| Immigrants | Thailand | 0.0 /100 | #289 | Tragic 2.7% |
| Immigrants | Hong Kong | 0.0 /100 | #290 | Tragic 2.7% |
| British West Indians | 0.0 /100 | #291 | Tragic 2.7% |
| Immigrants | Grenada | 0.0 /100 | #292 | Tragic 2.8% |
| Malaysians | 0.0 /100 | #293 | Tragic 2.8% |
| Immigrants | Eritrea | 0.0 /100 | #294 | Tragic 2.8% |
| Houma | 0.0 /100 | #295 | Tragic 2.8% |
| Immigrants | Immigrants | 0.0 /100 | #296 | Tragic 2.8% |
| Immigrants | Cuba | 0.0 /100 | #297 | Tragic 2.8% |
| Immigrants | Dominica | 0.0 /100 | #298 | Tragic 2.8% |
| Central American Indians | 0.0 /100 | #299 | Tragic 2.8% |
| Haitians | 0.0 /100 | #300 | Tragic 2.9% |
| Immigrants | South Eastern Asia | 0.0 /100 | #301 | Tragic 2.9% |
| Immigrants | Caribbean | 0.0 /100 | #302 | Tragic 2.9% |
Demographics Similar to Immigrants from Guatemala by No Schooling Completed
In terms of no schooling completed, the demographic groups most similar to Immigrants from Guatemala are Yakama (3.6%, a difference of 0.68%), Bangladeshi (3.5%, a difference of 1.0%), Immigrants from Central America (3.6%, a difference of 1.1%), Immigrants from Cabo Verde (3.5%, a difference of 1.2%), and Immigrants from Mexico (3.6%, a difference of 1.9%).
| Demographics | Rating | Rank | No Schooling Completed |
| Immigrants | Dominican Republic | 0.0 /100 | #333 | Tragic 3.4% |
| Guatemalans | 0.0 /100 | #334 | Tragic 3.5% |
| Immigrants | Cambodia | 0.0 /100 | #335 | Tragic 3.5% |
| Immigrants | Fiji | 0.0 /100 | #336 | Tragic 3.5% |
| Immigrants | Cabo Verde | 0.0 /100 | #337 | Tragic 3.5% |
| Bangladeshis | 0.0 /100 | #338 | Tragic 3.5% |
| Yakama | 0.0 /100 | #339 | Tragic 3.6% |
| Immigrants | Guatemala | 0.0 /100 | #340 | Tragic 3.6% |
| Immigrants | Central America | 0.0 /100 | #341 | Tragic 3.6% |
| Immigrants | Mexico | 0.0 /100 | #342 | Tragic 3.6% |
| Salvadorans | 0.0 /100 | #343 | Tragic 3.7% |
| Nepalese | 0.0 /100 | #344 | Tragic 3.8% |
| Immigrants | El Salvador | 0.0 /100 | #345 | Tragic 3.9% |
| Immigrants | Yemen | 0.0 /100 | #346 | Tragic 4.1% |
| Spanish American Indians | 0.0 /100 | #347 | Tragic 4.2% |