Swiss vs Immigrants from Guatemala No Schooling Completed
COMPARE
Swiss
Immigrants from Guatemala
No Schooling Completed
No Schooling Completed Comparison
Swiss
Immigrants from Guatemala
1.5%
NO SCHOOLING COMPLETED
100.0/ 100
METRIC RATING
32nd/ 347
METRIC RANK
3.6%
NO SCHOOLING COMPLETED
0.0/ 100
METRIC RATING
340th/ 347
METRIC RANK
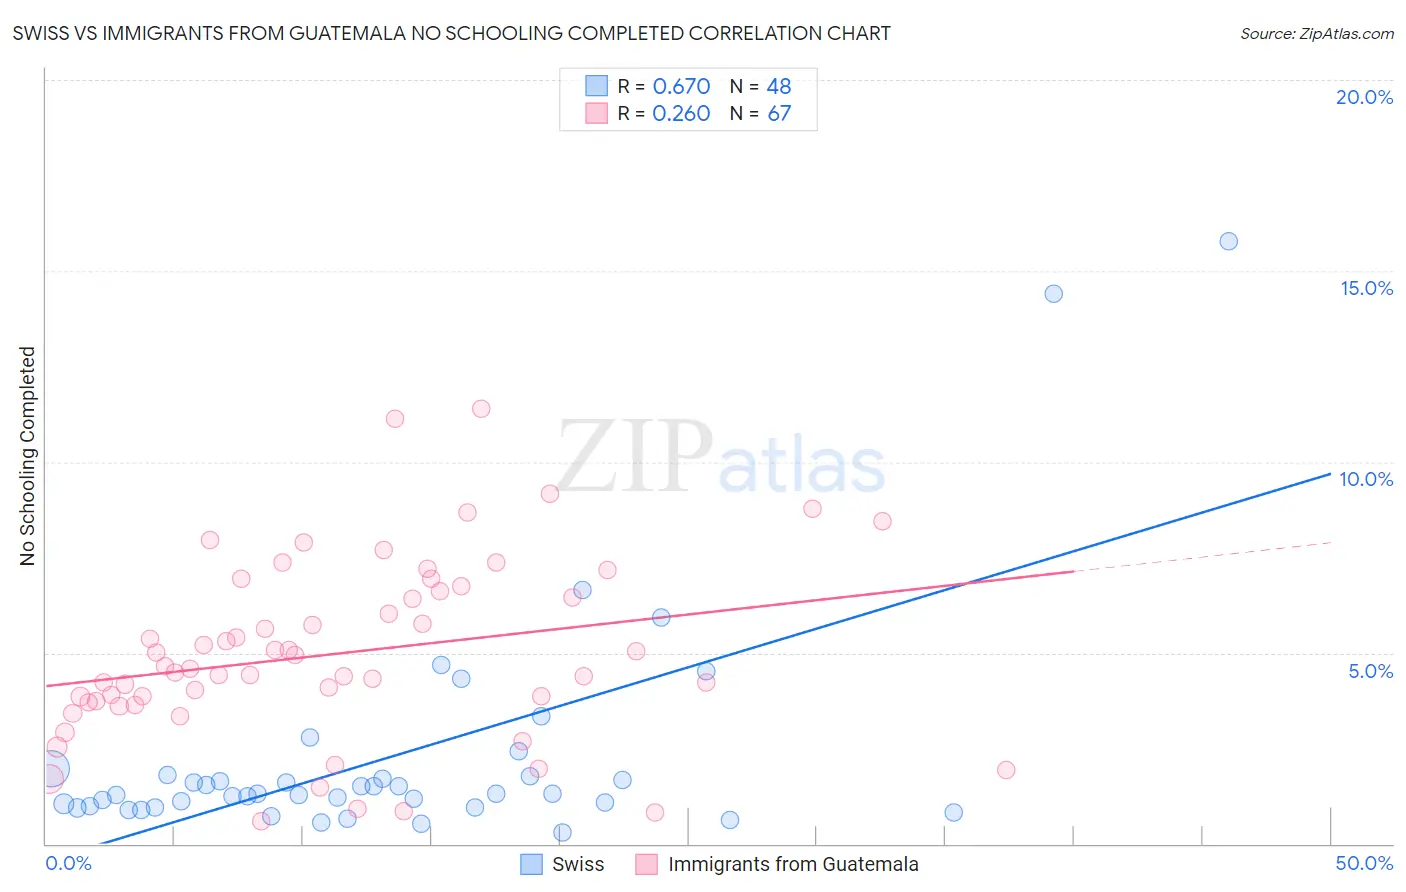
Swiss vs Immigrants from Guatemala No Schooling Completed Correlation Chart
The statistical analysis conducted on geographies consisting of 455,291,102 people shows a significant positive correlation between the proportion of Swiss and percentage of population with no schooling in the United States with a correlation coefficient (R) of 0.670 and weighted average of 1.5%. Similarly, the statistical analysis conducted on geographies consisting of 375,195,495 people shows a weak positive correlation between the proportion of Immigrants from Guatemala and percentage of population with no schooling in the United States with a correlation coefficient (R) of 0.260 and weighted average of 3.6%, a difference of 134.1%.
No Schooling Completed Correlation Summary
| Measurement | Swiss | Immigrants from Guatemala |
| Minimum | 0.31% | 0.58% |
| Maximum | 15.8% | 11.4% |
| Range | 15.5% | 10.8% |
| Mean | 2.3% | 5.0% |
| Median | 1.3% | 4.6% |
| Interquartile 25% (IQ1) | 0.97% | 3.7% |
| Interquartile 75% (IQ3) | 1.8% | 6.6% |
| Interquartile Range (IQR) | 0.82% | 2.9% |
| Standard Deviation (Sample) | 3.0% | 2.3% |
| Standard Deviation (Population) | 3.0% | 2.3% |
Similar Demographics by No Schooling Completed
Demographics Similar to Swiss by No Schooling Completed
In terms of no schooling completed, the demographic groups most similar to Swiss are Inupiat (1.5%, a difference of 0.39%), British (1.5%, a difference of 0.42%), Italian (1.5%, a difference of 0.68%), Lumbee (1.5%, a difference of 0.91%), and Latvian (1.5%, a difference of 0.94%).
| Demographics | Rating | Rank | No Schooling Completed |
| French | 100.0 /100 | #25 | Exceptional 1.5% |
| Czechs | 100.0 /100 | #26 | Exceptional 1.5% |
| Scandinavians | 100.0 /100 | #27 | Exceptional 1.5% |
| French Canadians | 100.0 /100 | #28 | Exceptional 1.5% |
| Lumbee | 100.0 /100 | #29 | Exceptional 1.5% |
| British | 100.0 /100 | #30 | Exceptional 1.5% |
| Inupiat | 100.0 /100 | #31 | Exceptional 1.5% |
| Swiss | 100.0 /100 | #32 | Exceptional 1.5% |
| Italians | 100.0 /100 | #33 | Exceptional 1.5% |
| Latvians | 100.0 /100 | #34 | Exceptional 1.5% |
| Eastern Europeans | 100.0 /100 | #35 | Exceptional 1.6% |
| Aleuts | 99.9 /100 | #36 | Exceptional 1.6% |
| Belgians | 99.9 /100 | #37 | Exceptional 1.6% |
| Northern Europeans | 99.9 /100 | #38 | Exceptional 1.6% |
| Native Hawaiians | 99.9 /100 | #39 | Exceptional 1.6% |
Demographics Similar to Immigrants from Guatemala by No Schooling Completed
In terms of no schooling completed, the demographic groups most similar to Immigrants from Guatemala are Yakama (3.6%, a difference of 0.68%), Bangladeshi (3.5%, a difference of 1.0%), Immigrants from Central America (3.6%, a difference of 1.1%), Immigrants from Cabo Verde (3.5%, a difference of 1.2%), and Immigrants from Mexico (3.6%, a difference of 1.9%).
| Demographics | Rating | Rank | No Schooling Completed |
| Immigrants | Dominican Republic | 0.0 /100 | #333 | Tragic 3.4% |
| Guatemalans | 0.0 /100 | #334 | Tragic 3.5% |
| Immigrants | Cambodia | 0.0 /100 | #335 | Tragic 3.5% |
| Immigrants | Fiji | 0.0 /100 | #336 | Tragic 3.5% |
| Immigrants | Cabo Verde | 0.0 /100 | #337 | Tragic 3.5% |
| Bangladeshis | 0.0 /100 | #338 | Tragic 3.5% |
| Yakama | 0.0 /100 | #339 | Tragic 3.6% |
| Immigrants | Guatemala | 0.0 /100 | #340 | Tragic 3.6% |
| Immigrants | Central America | 0.0 /100 | #341 | Tragic 3.6% |
| Immigrants | Mexico | 0.0 /100 | #342 | Tragic 3.6% |
| Salvadorans | 0.0 /100 | #343 | Tragic 3.7% |
| Nepalese | 0.0 /100 | #344 | Tragic 3.8% |
| Immigrants | El Salvador | 0.0 /100 | #345 | Tragic 3.9% |
| Immigrants | Yemen | 0.0 /100 | #346 | Tragic 4.1% |
| Spanish American Indians | 0.0 /100 | #347 | Tragic 4.2% |