Vietnamese vs Immigrants from Guatemala No Schooling Completed
COMPARE
Vietnamese
Immigrants from Guatemala
No Schooling Completed
No Schooling Completed Comparison
Vietnamese
Immigrants from Guatemala
3.2%
NO SCHOOLING COMPLETED
0.0/ 100
METRIC RATING
323rd/ 347
METRIC RANK
3.6%
NO SCHOOLING COMPLETED
0.0/ 100
METRIC RATING
340th/ 347
METRIC RANK
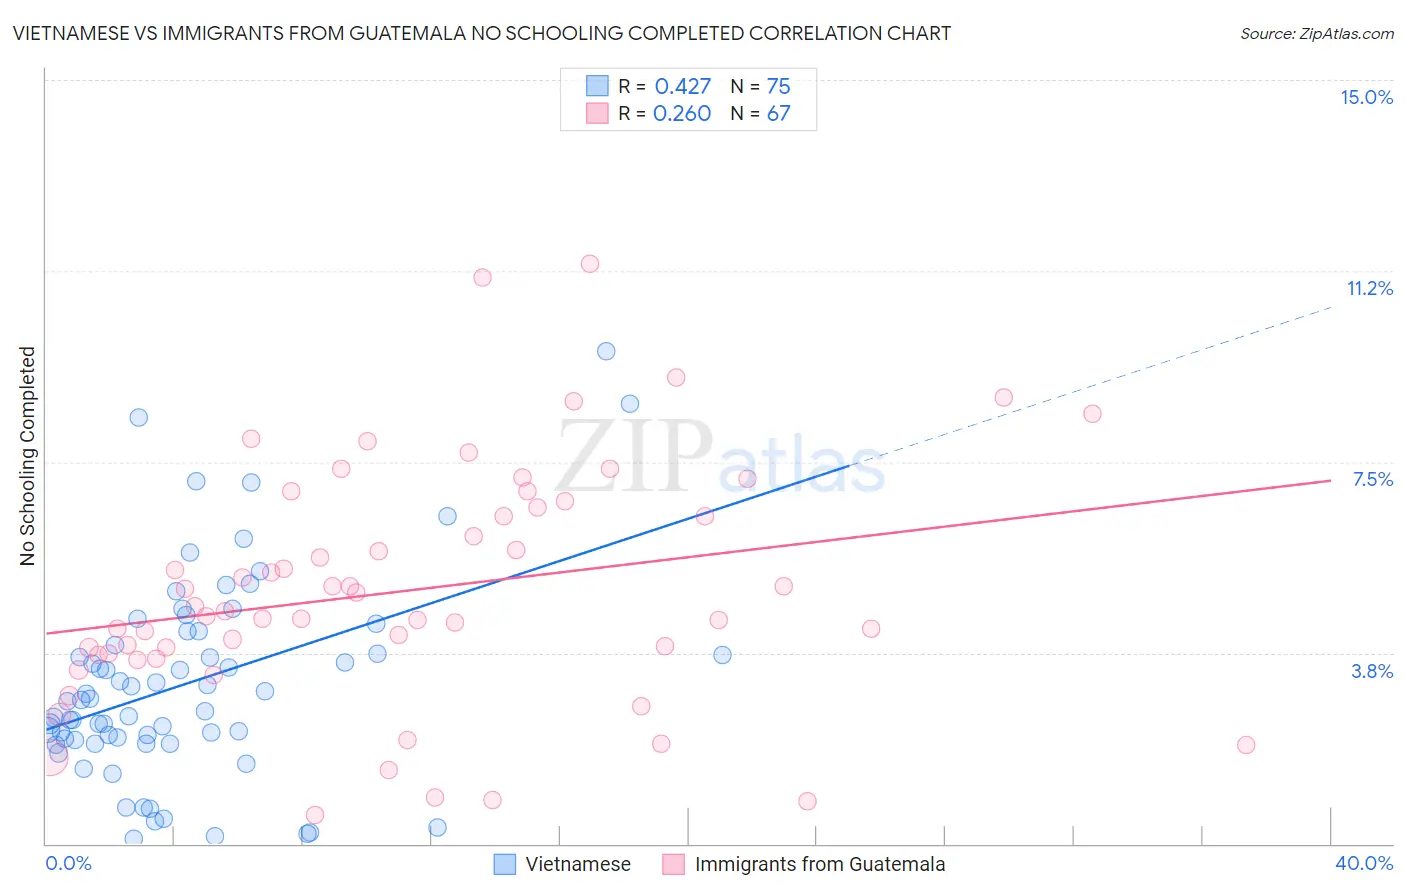
Vietnamese vs Immigrants from Guatemala No Schooling Completed Correlation Chart
The statistical analysis conducted on geographies consisting of 170,340,562 people shows a moderate positive correlation between the proportion of Vietnamese and percentage of population with no schooling in the United States with a correlation coefficient (R) of 0.427 and weighted average of 3.2%. Similarly, the statistical analysis conducted on geographies consisting of 375,195,495 people shows a weak positive correlation between the proportion of Immigrants from Guatemala and percentage of population with no schooling in the United States with a correlation coefficient (R) of 0.260 and weighted average of 3.6%, a difference of 12.6%.
No Schooling Completed Correlation Summary
| Measurement | Vietnamese | Immigrants from Guatemala |
| Minimum | 0.099% | 0.58% |
| Maximum | 9.7% | 11.4% |
| Range | 9.6% | 10.8% |
| Mean | 3.1% | 5.0% |
| Median | 2.8% | 4.6% |
| Interquartile 25% (IQ1) | 2.0% | 3.7% |
| Interquartile 75% (IQ3) | 4.2% | 6.6% |
| Interquartile Range (IQR) | 2.1% | 2.9% |
| Standard Deviation (Sample) | 2.0% | 2.3% |
| Standard Deviation (Population) | 2.0% | 2.3% |
Demographics Similar to Vietnamese and Immigrants from Guatemala by No Schooling Completed
In terms of no schooling completed, the demographic groups most similar to Vietnamese are Immigrants from Honduras (3.2%, a difference of 0.19%), Mexican American Indian (3.2%, a difference of 0.34%), Immigrants from Laos (3.1%, a difference of 0.86%), Dominican (3.2%, a difference of 1.0%), and Indonesian (3.2%, a difference of 1.1%). Similarly, the demographic groups most similar to Immigrants from Guatemala are Yakama (3.6%, a difference of 0.68%), Bangladeshi (3.5%, a difference of 1.0%), Immigrants from Central America (3.6%, a difference of 1.1%), Immigrants from Cabo Verde (3.5%, a difference of 1.2%), and Immigrants from Fiji (3.5%, a difference of 1.9%).
| Demographics | Rating | Rank | No Schooling Completed |
| Immigrants | Laos | 0.0 /100 | #321 | Tragic 3.1% |
| Immigrants | Honduras | 0.0 /100 | #322 | Tragic 3.2% |
| Vietnamese | 0.0 /100 | #323 | Tragic 3.2% |
| Mexican American Indians | 0.0 /100 | #324 | Tragic 3.2% |
| Dominicans | 0.0 /100 | #325 | Tragic 3.2% |
| Indonesians | 0.0 /100 | #326 | Tragic 3.2% |
| Immigrants | Latin America | 0.0 /100 | #327 | Tragic 3.3% |
| Mexicans | 0.0 /100 | #328 | Tragic 3.3% |
| Immigrants | Vietnam | 0.0 /100 | #329 | Tragic 3.3% |
| Immigrants | Armenia | 0.0 /100 | #330 | Tragic 3.3% |
| Japanese | 0.0 /100 | #331 | Tragic 3.3% |
| Central Americans | 0.0 /100 | #332 | Tragic 3.4% |
| Immigrants | Dominican Republic | 0.0 /100 | #333 | Tragic 3.4% |
| Guatemalans | 0.0 /100 | #334 | Tragic 3.5% |
| Immigrants | Cambodia | 0.0 /100 | #335 | Tragic 3.5% |
| Immigrants | Fiji | 0.0 /100 | #336 | Tragic 3.5% |
| Immigrants | Cabo Verde | 0.0 /100 | #337 | Tragic 3.5% |
| Bangladeshis | 0.0 /100 | #338 | Tragic 3.5% |
| Yakama | 0.0 /100 | #339 | Tragic 3.6% |
| Immigrants | Guatemala | 0.0 /100 | #340 | Tragic 3.6% |
| Immigrants | Central America | 0.0 /100 | #341 | Tragic 3.6% |