Lithuanian vs Haitian 7th Grade
COMPARE
Lithuanian
Haitian
7th Grade
7th Grade Comparison
Lithuanians
Haitians
97.5%
7TH GRADE
100.0/ 100
METRIC RATING
19th/ 347
METRIC RANK
94.7%
7TH GRADE
0.0/ 100
METRIC RATING
294th/ 347
METRIC RANK
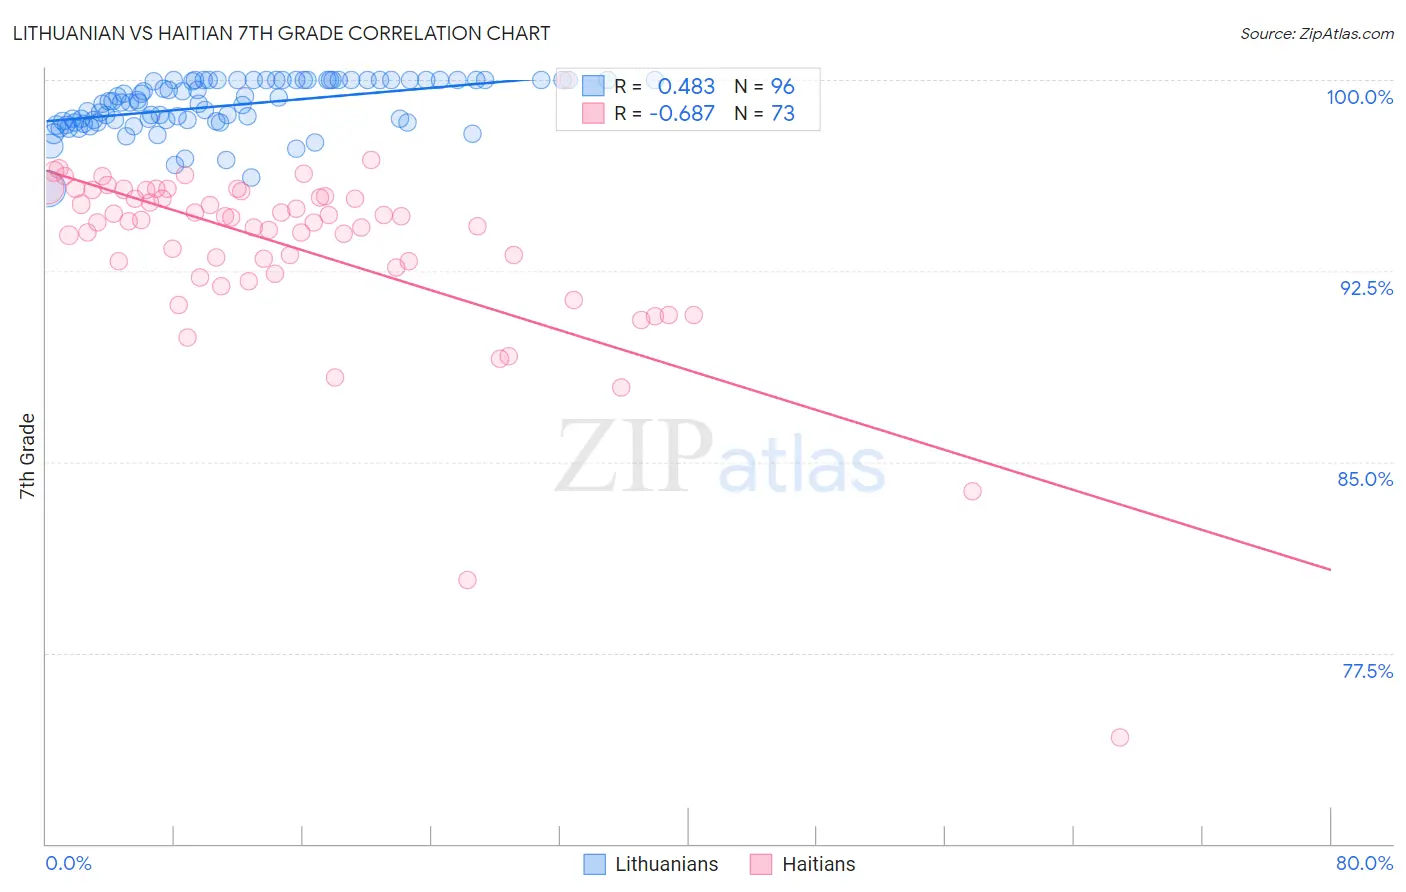
Lithuanian vs Haitian 7th Grade Correlation Chart
The statistical analysis conducted on geographies consisting of 421,947,029 people shows a moderate positive correlation between the proportion of Lithuanians and percentage of population with at least 7th grade education in the United States with a correlation coefficient (R) of 0.483 and weighted average of 97.5%. Similarly, the statistical analysis conducted on geographies consisting of 287,965,116 people shows a significant negative correlation between the proportion of Haitians and percentage of population with at least 7th grade education in the United States with a correlation coefficient (R) of -0.687 and weighted average of 94.7%, a difference of 3.0%.
7th Grade Correlation Summary
| Measurement | Lithuanian | Haitian |
| Minimum | 95.7% | 74.2% |
| Maximum | 100.0% | 100.0% |
| Range | 4.3% | 25.8% |
| Mean | 99.0% | 93.4% |
| Median | 99.1% | 94.5% |
| Interquartile 25% (IQ1) | 98.4% | 92.5% |
| Interquartile 75% (IQ3) | 100.0% | 95.5% |
| Interquartile Range (IQR) | 1.6% | 3.0% |
| Standard Deviation (Sample) | 1.00% | 3.7% |
| Standard Deviation (Population) | 0.99% | 3.7% |
Similar Demographics by 7th Grade
Demographics Similar to Lithuanians by 7th Grade
In terms of 7th grade, the demographic groups most similar to Lithuanians are Tlingit-Haida (97.5%, a difference of 0.010%), Scottish (97.5%, a difference of 0.020%), Irish (97.5%, a difference of 0.030%), Yup'ik (97.4%, a difference of 0.040%), and Inupiat (97.4%, a difference of 0.060%).
| Demographics | Rating | Rank | 7th Grade |
| Poles | 100.0 /100 | #12 | Exceptional 97.6% |
| Swedes | 100.0 /100 | #13 | Exceptional 97.6% |
| Pennsylvania Germans | 100.0 /100 | #14 | Exceptional 97.6% |
| English | 100.0 /100 | #15 | Exceptional 97.6% |
| Irish | 100.0 /100 | #16 | Exceptional 97.5% |
| Scottish | 100.0 /100 | #17 | Exceptional 97.5% |
| Tlingit-Haida | 100.0 /100 | #18 | Exceptional 97.5% |
| Lithuanians | 100.0 /100 | #19 | Exceptional 97.5% |
| Yup'ik | 100.0 /100 | #20 | Exceptional 97.4% |
| Inupiat | 100.0 /100 | #21 | Exceptional 97.4% |
| French Canadians | 100.0 /100 | #22 | Exceptional 97.4% |
| Croatians | 100.0 /100 | #23 | Exceptional 97.4% |
| Welsh | 100.0 /100 | #24 | Exceptional 97.4% |
| French | 100.0 /100 | #25 | Exceptional 97.4% |
| Scotch-Irish | 100.0 /100 | #26 | Exceptional 97.4% |
Demographics Similar to Haitians by 7th Grade
In terms of 7th grade, the demographic groups most similar to Haitians are Yaqui (94.6%, a difference of 0.030%), Cuban (94.6%, a difference of 0.040%), Fijian (94.7%, a difference of 0.080%), Immigrants from West Indies (94.8%, a difference of 0.10%), and Immigrants from Grenada (94.8%, a difference of 0.12%).
| Demographics | Rating | Rank | 7th Grade |
| Immigrants | Peru | 0.0 /100 | #287 | Tragic 94.9% |
| British West Indians | 0.0 /100 | #288 | Tragic 94.8% |
| Taiwanese | 0.0 /100 | #289 | Tragic 94.8% |
| Malaysians | 0.0 /100 | #290 | Tragic 94.8% |
| Immigrants | Grenada | 0.0 /100 | #291 | Tragic 94.8% |
| Immigrants | West Indies | 0.0 /100 | #292 | Tragic 94.8% |
| Fijians | 0.0 /100 | #293 | Tragic 94.7% |
| Haitians | 0.0 /100 | #294 | Tragic 94.7% |
| Yaqui | 0.0 /100 | #295 | Tragic 94.6% |
| Cubans | 0.0 /100 | #296 | Tragic 94.6% |
| Immigrants | South Eastern Asia | 0.0 /100 | #297 | Tragic 94.5% |
| Indonesians | 0.0 /100 | #298 | Tragic 94.5% |
| Bangladeshis | 0.0 /100 | #299 | Tragic 94.5% |
| Immigrants | Burma/Myanmar | 0.0 /100 | #300 | Tragic 94.5% |
| Immigrants | Dominica | 0.0 /100 | #301 | Tragic 94.5% |