Lithuanian vs Immigrants from Armenia 7th Grade
COMPARE
Lithuanian
Immigrants from Armenia
7th Grade
7th Grade Comparison
Lithuanians
Immigrants from Armenia
97.5%
7TH GRADE
100.0/ 100
METRIC RATING
19th/ 347
METRIC RANK
92.7%
7TH GRADE
0.0/ 100
METRIC RATING
333rd/ 347
METRIC RANK
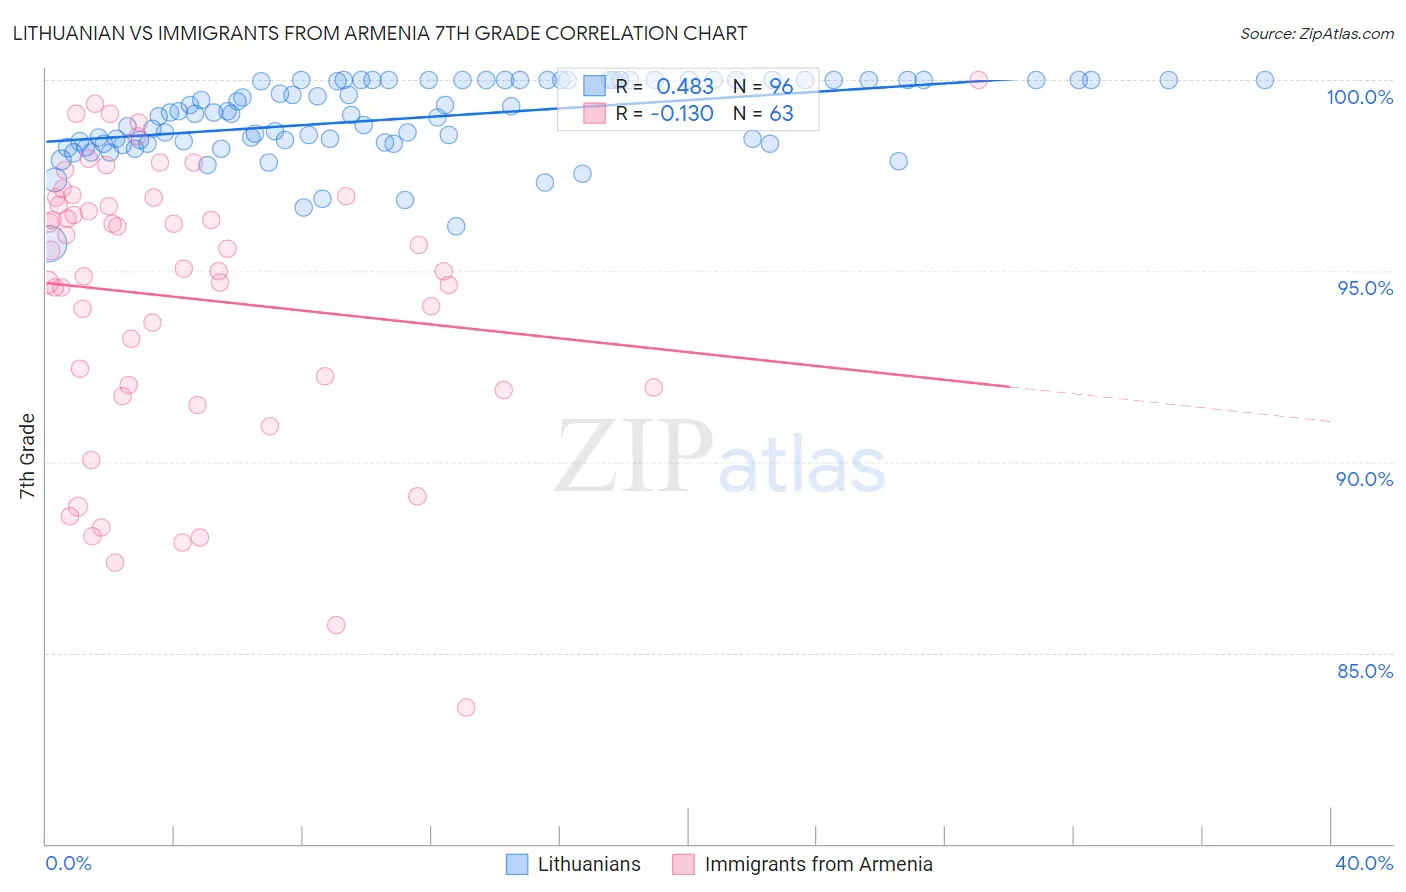
Lithuanian vs Immigrants from Armenia 7th Grade Correlation Chart
The statistical analysis conducted on geographies consisting of 421,947,029 people shows a moderate positive correlation between the proportion of Lithuanians and percentage of population with at least 7th grade education in the United States with a correlation coefficient (R) of 0.483 and weighted average of 97.5%. Similarly, the statistical analysis conducted on geographies consisting of 97,657,339 people shows a poor negative correlation between the proportion of Immigrants from Armenia and percentage of population with at least 7th grade education in the United States with a correlation coefficient (R) of -0.130 and weighted average of 92.7%, a difference of 5.1%.
7th Grade Correlation Summary
| Measurement | Lithuanian | Immigrants from Armenia |
| Minimum | 95.7% | 83.6% |
| Maximum | 100.0% | 100.0% |
| Range | 4.3% | 16.4% |
| Mean | 99.0% | 94.3% |
| Median | 99.1% | 95.1% |
| Interquartile 25% (IQ1) | 98.4% | 91.9% |
| Interquartile 75% (IQ3) | 100.0% | 96.9% |
| Interquartile Range (IQR) | 1.6% | 5.0% |
| Standard Deviation (Sample) | 1.00% | 3.7% |
| Standard Deviation (Population) | 0.99% | 3.7% |
Similar Demographics by 7th Grade
Demographics Similar to Lithuanians by 7th Grade
In terms of 7th grade, the demographic groups most similar to Lithuanians are Tlingit-Haida (97.5%, a difference of 0.010%), Scottish (97.5%, a difference of 0.020%), Irish (97.5%, a difference of 0.030%), Yup'ik (97.4%, a difference of 0.040%), and Inupiat (97.4%, a difference of 0.060%).
| Demographics | Rating | Rank | 7th Grade |
| Poles | 100.0 /100 | #12 | Exceptional 97.6% |
| Swedes | 100.0 /100 | #13 | Exceptional 97.6% |
| Pennsylvania Germans | 100.0 /100 | #14 | Exceptional 97.6% |
| English | 100.0 /100 | #15 | Exceptional 97.6% |
| Irish | 100.0 /100 | #16 | Exceptional 97.5% |
| Scottish | 100.0 /100 | #17 | Exceptional 97.5% |
| Tlingit-Haida | 100.0 /100 | #18 | Exceptional 97.5% |
| Lithuanians | 100.0 /100 | #19 | Exceptional 97.5% |
| Yup'ik | 100.0 /100 | #20 | Exceptional 97.4% |
| Inupiat | 100.0 /100 | #21 | Exceptional 97.4% |
| French Canadians | 100.0 /100 | #22 | Exceptional 97.4% |
| Croatians | 100.0 /100 | #23 | Exceptional 97.4% |
| Welsh | 100.0 /100 | #24 | Exceptional 97.4% |
| French | 100.0 /100 | #25 | Exceptional 97.4% |
| Scotch-Irish | 100.0 /100 | #26 | Exceptional 97.4% |
Demographics Similar to Immigrants from Armenia by 7th Grade
In terms of 7th grade, the demographic groups most similar to Immigrants from Armenia are Hispanic or Latino (92.7%, a difference of 0.020%), Immigrants from Yemen (92.6%, a difference of 0.080%), Honduran (92.9%, a difference of 0.16%), Mexican American Indian (92.6%, a difference of 0.18%), and Immigrants from Dominican Republic (92.9%, a difference of 0.20%).
| Demographics | Rating | Rank | 7th Grade |
| Nepalese | 0.0 /100 | #326 | Tragic 93.2% |
| Immigrants | Cabo Verde | 0.0 /100 | #327 | Tragic 93.1% |
| Immigrants | Nicaragua | 0.0 /100 | #328 | Tragic 93.0% |
| Immigrants | Azores | 0.0 /100 | #329 | Tragic 93.0% |
| Immigrants | Dominican Republic | 0.0 /100 | #330 | Tragic 92.9% |
| Hondurans | 0.0 /100 | #331 | Tragic 92.9% |
| Hispanics or Latinos | 0.0 /100 | #332 | Tragic 92.7% |
| Immigrants | Armenia | 0.0 /100 | #333 | Tragic 92.7% |
| Immigrants | Yemen | 0.0 /100 | #334 | Tragic 92.6% |
| Mexican American Indians | 0.0 /100 | #335 | Tragic 92.6% |
| Immigrants | Honduras | 0.0 /100 | #336 | Tragic 92.5% |
| Immigrants | Latin America | 0.0 /100 | #337 | Tragic 92.2% |
| Central Americans | 0.0 /100 | #338 | Tragic 92.1% |
| Mexicans | 0.0 /100 | #339 | Tragic 91.9% |
| Yakama | 0.0 /100 | #340 | Tragic 91.7% |