Lithuanian vs Immigrants from Eastern Europe 7th Grade
COMPARE
Lithuanian
Immigrants from Eastern Europe
7th Grade
7th Grade Comparison
Lithuanians
Immigrants from Eastern Europe
97.5%
7TH GRADE
100.0/ 100
METRIC RATING
19th/ 347
METRIC RANK
96.3%
7TH GRADE
83.7/ 100
METRIC RATING
146th/ 347
METRIC RANK
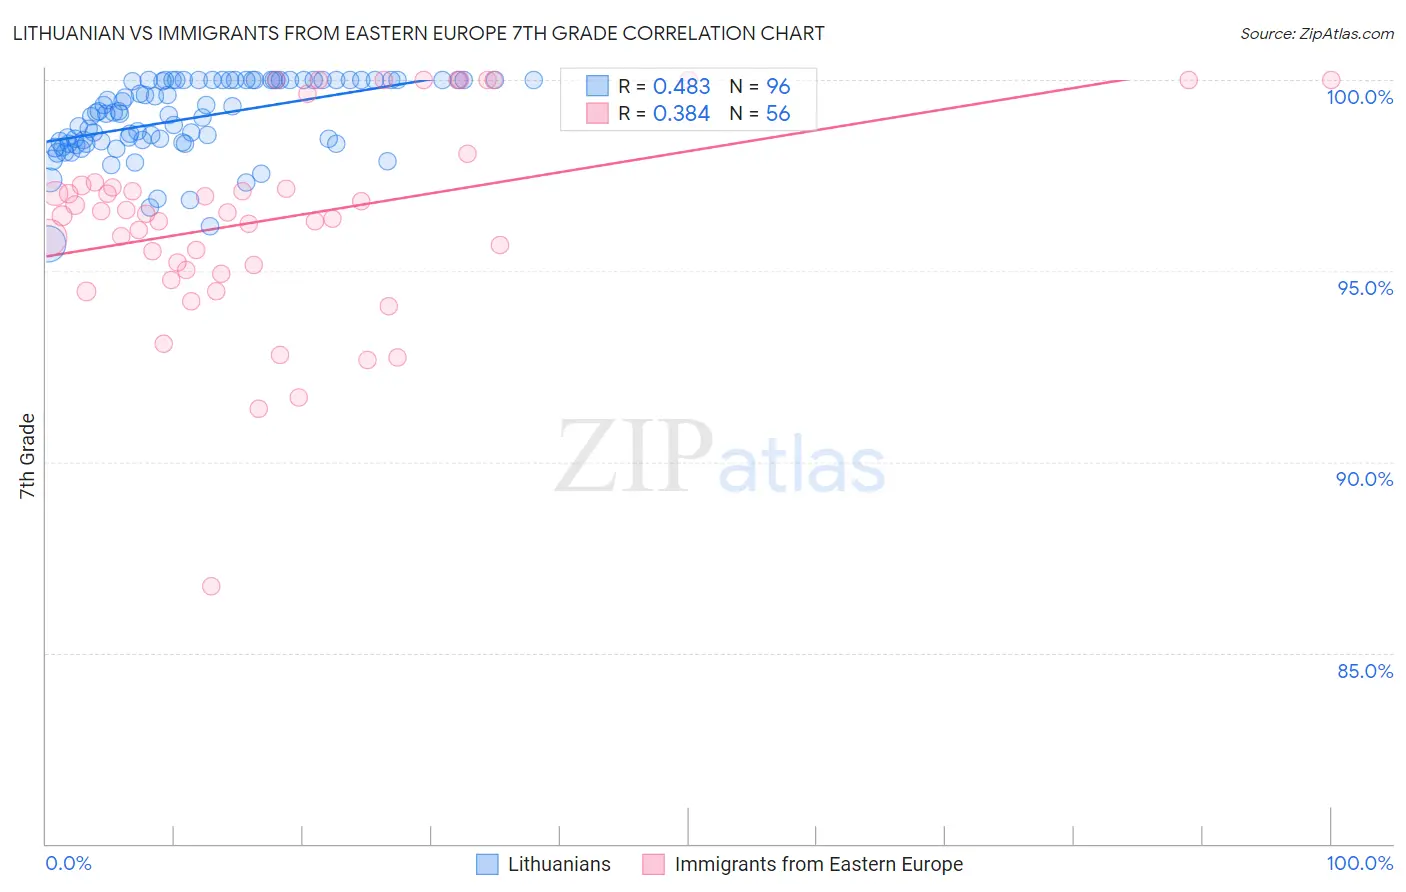
Lithuanian vs Immigrants from Eastern Europe 7th Grade Correlation Chart
The statistical analysis conducted on geographies consisting of 421,947,029 people shows a moderate positive correlation between the proportion of Lithuanians and percentage of population with at least 7th grade education in the United States with a correlation coefficient (R) of 0.483 and weighted average of 97.5%. Similarly, the statistical analysis conducted on geographies consisting of 475,879,420 people shows a mild positive correlation between the proportion of Immigrants from Eastern Europe and percentage of population with at least 7th grade education in the United States with a correlation coefficient (R) of 0.384 and weighted average of 96.3%, a difference of 1.3%.
7th Grade Correlation Summary
| Measurement | Lithuanian | Immigrants from Eastern Europe |
| Minimum | 95.7% | 86.7% |
| Maximum | 100.0% | 100.0% |
| Range | 4.3% | 13.3% |
| Mean | 99.0% | 96.4% |
| Median | 99.1% | 96.5% |
| Interquartile 25% (IQ1) | 98.4% | 95.1% |
| Interquartile 75% (IQ3) | 100.0% | 97.3% |
| Interquartile Range (IQR) | 1.6% | 2.2% |
| Standard Deviation (Sample) | 1.00% | 2.6% |
| Standard Deviation (Population) | 0.99% | 2.6% |
Similar Demographics by 7th Grade
Demographics Similar to Lithuanians by 7th Grade
In terms of 7th grade, the demographic groups most similar to Lithuanians are Tlingit-Haida (97.5%, a difference of 0.010%), Scottish (97.5%, a difference of 0.020%), Irish (97.5%, a difference of 0.030%), Yup'ik (97.4%, a difference of 0.040%), and Inupiat (97.4%, a difference of 0.060%).
| Demographics | Rating | Rank | 7th Grade |
| Poles | 100.0 /100 | #12 | Exceptional 97.6% |
| Swedes | 100.0 /100 | #13 | Exceptional 97.6% |
| Pennsylvania Germans | 100.0 /100 | #14 | Exceptional 97.6% |
| English | 100.0 /100 | #15 | Exceptional 97.6% |
| Irish | 100.0 /100 | #16 | Exceptional 97.5% |
| Scottish | 100.0 /100 | #17 | Exceptional 97.5% |
| Tlingit-Haida | 100.0 /100 | #18 | Exceptional 97.5% |
| Lithuanians | 100.0 /100 | #19 | Exceptional 97.5% |
| Yup'ik | 100.0 /100 | #20 | Exceptional 97.4% |
| Inupiat | 100.0 /100 | #21 | Exceptional 97.4% |
| French Canadians | 100.0 /100 | #22 | Exceptional 97.4% |
| Croatians | 100.0 /100 | #23 | Exceptional 97.4% |
| Welsh | 100.0 /100 | #24 | Exceptional 97.4% |
| French | 100.0 /100 | #25 | Exceptional 97.4% |
| Scotch-Irish | 100.0 /100 | #26 | Exceptional 97.4% |
Demographics Similar to Immigrants from Eastern Europe by 7th Grade
In terms of 7th grade, the demographic groups most similar to Immigrants from Eastern Europe are Blackfeet (96.3%, a difference of 0.0%), French American Indian (96.3%, a difference of 0.010%), Israeli (96.3%, a difference of 0.010%), Albanian (96.3%, a difference of 0.010%), and Immigrants from Belarus (96.3%, a difference of 0.010%).
| Demographics | Rating | Rank | 7th Grade |
| Basques | 89.3 /100 | #139 | Excellent 96.4% |
| Cambodians | 88.3 /100 | #140 | Excellent 96.3% |
| Immigrants | South Central Asia | 87.1 /100 | #141 | Excellent 96.3% |
| Burmese | 87.1 /100 | #142 | Excellent 96.3% |
| Spanish | 86.6 /100 | #143 | Excellent 96.3% |
| Immigrants | Greece | 85.9 /100 | #144 | Excellent 96.3% |
| Blackfeet | 83.9 /100 | #145 | Excellent 96.3% |
| Immigrants | Eastern Europe | 83.7 /100 | #146 | Excellent 96.3% |
| French American Indians | 83.1 /100 | #147 | Excellent 96.3% |
| Israelis | 82.8 /100 | #148 | Excellent 96.3% |
| Albanians | 82.6 /100 | #149 | Excellent 96.3% |
| Immigrants | Belarus | 82.4 /100 | #150 | Excellent 96.3% |
| Hopi | 81.6 /100 | #151 | Excellent 96.3% |
| Immigrants | Russia | 78.4 /100 | #152 | Good 96.2% |
| Seminole | 78.1 /100 | #153 | Good 96.2% |