Lithuanian vs Ugandan 7th Grade
COMPARE
Lithuanian
Ugandan
7th Grade
7th Grade Comparison
Lithuanians
Ugandans
97.5%
7TH GRADE
100.0/ 100
METRIC RATING
19th/ 347
METRIC RANK
96.2%
7TH GRADE
75.5/ 100
METRIC RATING
157th/ 347
METRIC RANK
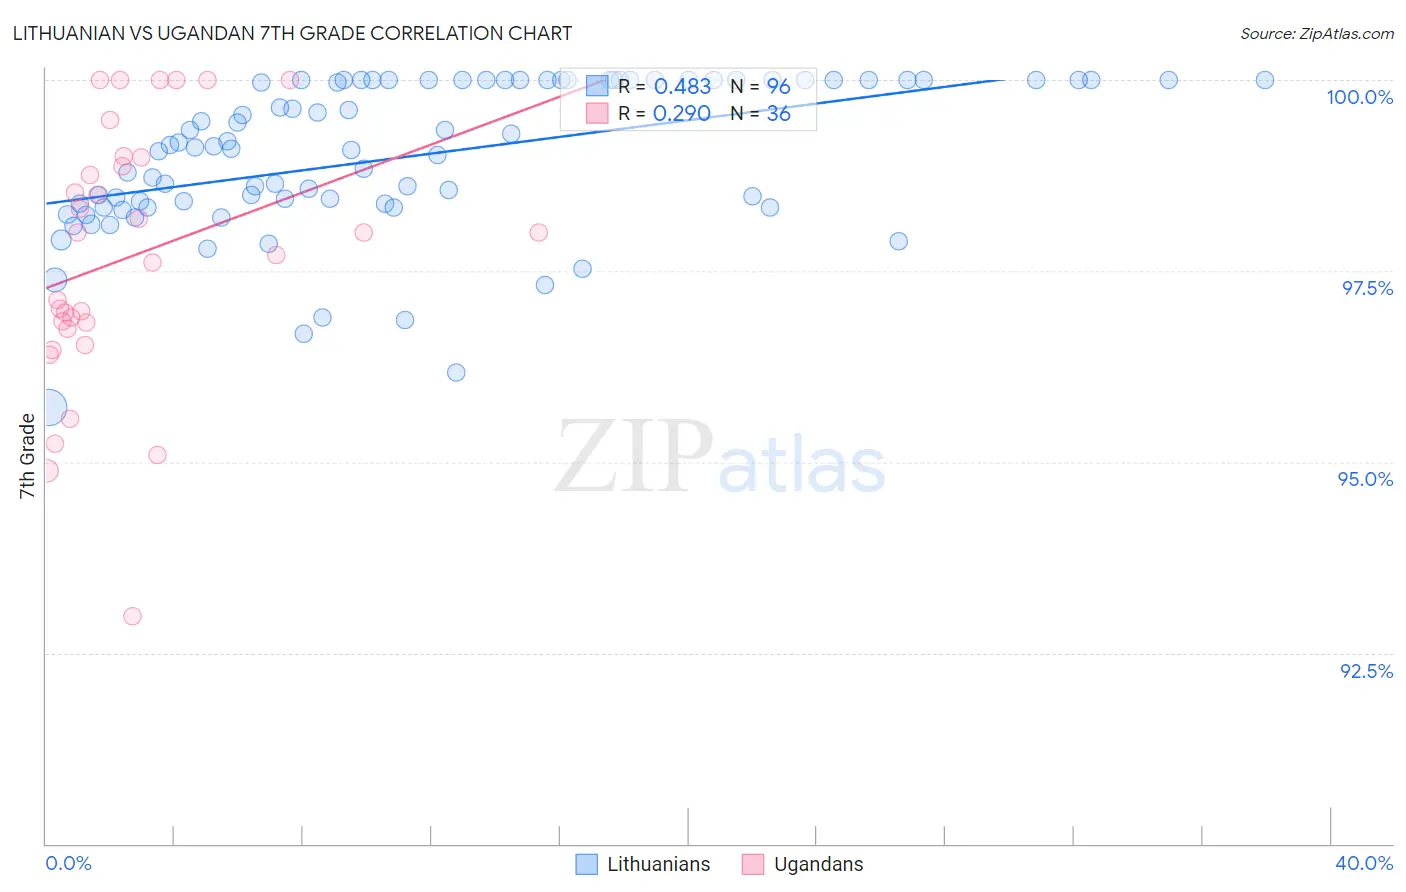
Lithuanian vs Ugandan 7th Grade Correlation Chart
The statistical analysis conducted on geographies consisting of 421,947,029 people shows a moderate positive correlation between the proportion of Lithuanians and percentage of population with at least 7th grade education in the United States with a correlation coefficient (R) of 0.483 and weighted average of 97.5%. Similarly, the statistical analysis conducted on geographies consisting of 93,991,892 people shows a weak positive correlation between the proportion of Ugandans and percentage of population with at least 7th grade education in the United States with a correlation coefficient (R) of 0.290 and weighted average of 96.2%, a difference of 1.3%.
7th Grade Correlation Summary
| Measurement | Lithuanian | Ugandan |
| Minimum | 95.7% | 93.0% |
| Maximum | 100.0% | 100.0% |
| Range | 4.3% | 7.0% |
| Mean | 99.0% | 97.7% |
| Median | 99.1% | 97.9% |
| Interquartile 25% (IQ1) | 98.4% | 96.8% |
| Interquartile 75% (IQ3) | 100.0% | 98.9% |
| Interquartile Range (IQR) | 1.6% | 2.1% |
| Standard Deviation (Sample) | 1.00% | 1.7% |
| Standard Deviation (Population) | 0.99% | 1.7% |
Similar Demographics by 7th Grade
Demographics Similar to Lithuanians by 7th Grade
In terms of 7th grade, the demographic groups most similar to Lithuanians are Tlingit-Haida (97.5%, a difference of 0.010%), Scottish (97.5%, a difference of 0.020%), Irish (97.5%, a difference of 0.030%), Yup'ik (97.4%, a difference of 0.040%), and Inupiat (97.4%, a difference of 0.060%).
| Demographics | Rating | Rank | 7th Grade |
| Poles | 100.0 /100 | #12 | Exceptional 97.6% |
| Swedes | 100.0 /100 | #13 | Exceptional 97.6% |
| Pennsylvania Germans | 100.0 /100 | #14 | Exceptional 97.6% |
| English | 100.0 /100 | #15 | Exceptional 97.6% |
| Irish | 100.0 /100 | #16 | Exceptional 97.5% |
| Scottish | 100.0 /100 | #17 | Exceptional 97.5% |
| Tlingit-Haida | 100.0 /100 | #18 | Exceptional 97.5% |
| Lithuanians | 100.0 /100 | #19 | Exceptional 97.5% |
| Yup'ik | 100.0 /100 | #20 | Exceptional 97.4% |
| Inupiat | 100.0 /100 | #21 | Exceptional 97.4% |
| French Canadians | 100.0 /100 | #22 | Exceptional 97.4% |
| Croatians | 100.0 /100 | #23 | Exceptional 97.4% |
| Welsh | 100.0 /100 | #24 | Exceptional 97.4% |
| French | 100.0 /100 | #25 | Exceptional 97.4% |
| Scotch-Irish | 100.0 /100 | #26 | Exceptional 97.4% |
Demographics Similar to Ugandans by 7th Grade
In terms of 7th grade, the demographic groups most similar to Ugandans are Immigrants from Jordan (96.2%, a difference of 0.010%), Kenyan (96.2%, a difference of 0.010%), Seminole (96.2%, a difference of 0.020%), Immigrants from Israel (96.2%, a difference of 0.020%), and Immigrants from Russia (96.2%, a difference of 0.030%).
| Demographics | Rating | Rank | 7th Grade |
| Immigrants | Belarus | 82.4 /100 | #150 | Excellent 96.3% |
| Hopi | 81.6 /100 | #151 | Excellent 96.3% |
| Immigrants | Russia | 78.4 /100 | #152 | Good 96.2% |
| Seminole | 78.1 /100 | #153 | Good 96.2% |
| Immigrants | Israel | 77.6 /100 | #154 | Good 96.2% |
| Immigrants | Jordan | 77.0 /100 | #155 | Good 96.2% |
| Kenyans | 76.2 /100 | #156 | Good 96.2% |
| Ugandans | 75.5 /100 | #157 | Good 96.2% |
| Arabs | 68.6 /100 | #158 | Good 96.2% |
| Alsatians | 67.2 /100 | #159 | Good 96.1% |
| Immigrants | Kenya | 66.8 /100 | #160 | Good 96.1% |
| Bermudans | 66.3 /100 | #161 | Good 96.1% |
| Pima | 64.3 /100 | #162 | Good 96.1% |
| Spaniards | 62.6 /100 | #163 | Good 96.1% |
| Immigrants | Italy | 62.1 /100 | #164 | Good 96.1% |