Lithuanian vs Immigrants from Morocco Associate's Degree
COMPARE
Lithuanian
Immigrants from Morocco
Associate's Degree
Associate's Degree Comparison
Lithuanians
Immigrants from Morocco
50.6%
ASSOCIATE'S DEGREE
99.3/ 100
METRIC RATING
74th/ 347
METRIC RANK
49.2%
ASSOCIATE'S DEGREE
96.3/ 100
METRIC RATING
109th/ 347
METRIC RANK
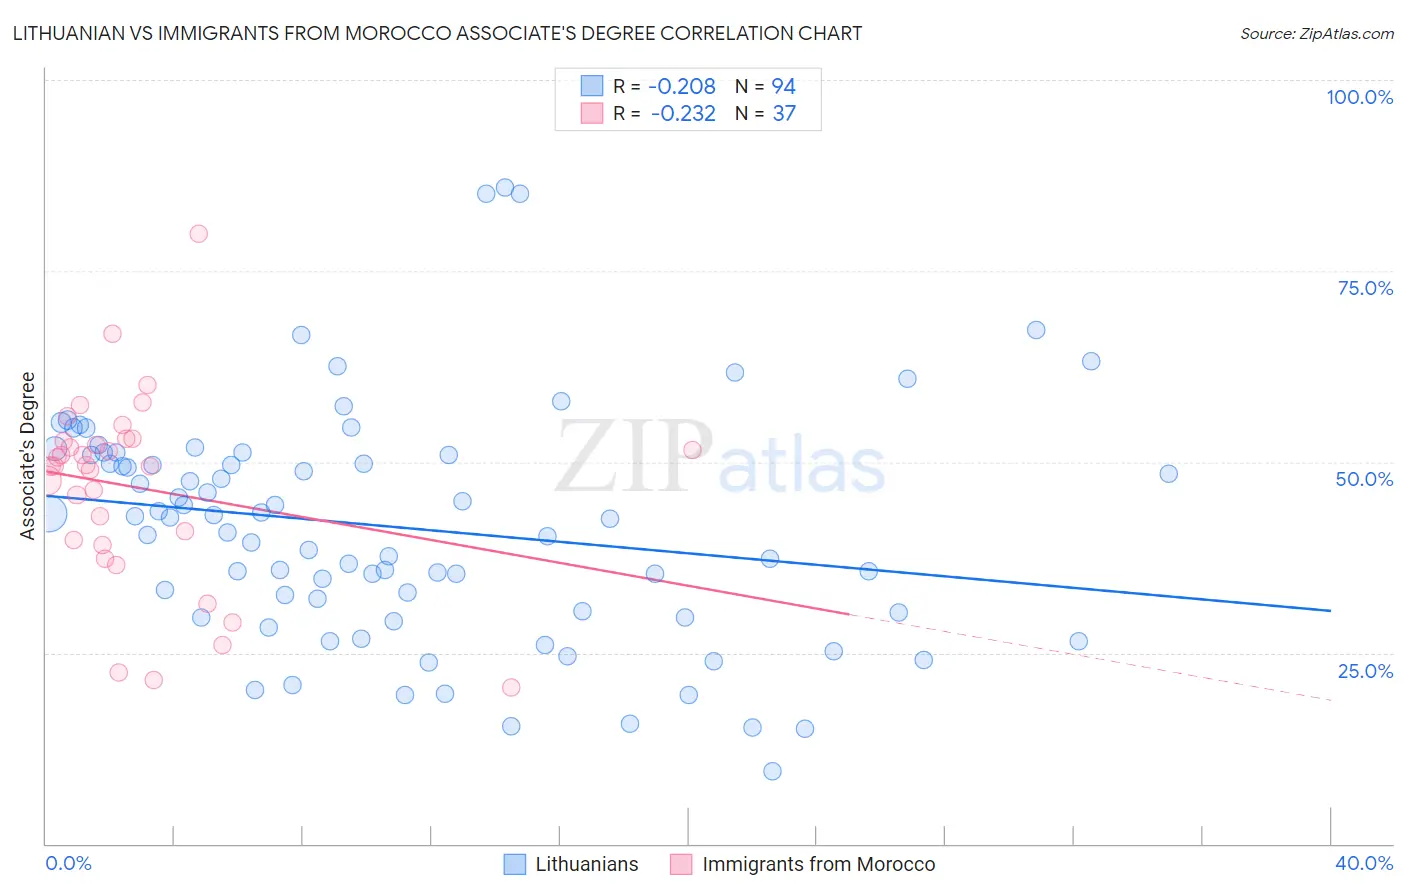
Lithuanian vs Immigrants from Morocco Associate's Degree Correlation Chart
The statistical analysis conducted on geographies consisting of 421,924,512 people shows a weak negative correlation between the proportion of Lithuanians and percentage of population with at least associate's degree education in the United States with a correlation coefficient (R) of -0.208 and weighted average of 50.6%. Similarly, the statistical analysis conducted on geographies consisting of 178,912,438 people shows a weak negative correlation between the proportion of Immigrants from Morocco and percentage of population with at least associate's degree education in the United States with a correlation coefficient (R) of -0.232 and weighted average of 49.2%, a difference of 2.9%.
Associate's Degree Correlation Summary
| Measurement | Lithuanian | Immigrants from Morocco |
| Minimum | 9.5% | 20.4% |
| Maximum | 85.9% | 79.9% |
| Range | 76.4% | 59.4% |
| Mean | 41.4% | 46.6% |
| Median | 42.6% | 49.4% |
| Interquartile 25% (IQ1) | 30.2% | 39.4% |
| Interquartile 75% (IQ3) | 50.9% | 52.8% |
| Interquartile Range (IQR) | 20.7% | 13.4% |
| Standard Deviation (Sample) | 15.3% | 12.5% |
| Standard Deviation (Population) | 15.3% | 12.3% |
Similar Demographics by Associate's Degree
Demographics Similar to Lithuanians by Associate's Degree
In terms of associate's degree, the demographic groups most similar to Lithuanians are Immigrants from Scotland (50.6%, a difference of 0.040%), Carpatho Rusyn (50.6%, a difference of 0.060%), Immigrants from Zimbabwe (50.5%, a difference of 0.25%), Immigrants from Lebanon (50.5%, a difference of 0.28%), and Immigrants from Eastern Europe (50.5%, a difference of 0.33%).
| Demographics | Rating | Rank | Associate's Degree |
| Argentineans | 99.6 /100 | #67 | Exceptional 51.2% |
| Immigrants | Indonesia | 99.5 /100 | #68 | Exceptional 51.0% |
| Egyptians | 99.5 /100 | #69 | Exceptional 50.9% |
| Immigrants | Argentina | 99.5 /100 | #70 | Exceptional 50.9% |
| Immigrants | Romania | 99.5 /100 | #71 | Exceptional 50.9% |
| Immigrants | Pakistan | 99.5 /100 | #72 | Exceptional 50.9% |
| Carpatho Rusyns | 99.3 /100 | #73 | Exceptional 50.6% |
| Lithuanians | 99.3 /100 | #74 | Exceptional 50.6% |
| Immigrants | Scotland | 99.3 /100 | #75 | Exceptional 50.6% |
| Immigrants | Zimbabwe | 99.2 /100 | #76 | Exceptional 50.5% |
| Immigrants | Lebanon | 99.1 /100 | #77 | Exceptional 50.5% |
| Immigrants | Eastern Europe | 99.1 /100 | #78 | Exceptional 50.5% |
| Ethiopians | 99.1 /100 | #79 | Exceptional 50.4% |
| Armenians | 99.1 /100 | #80 | Exceptional 50.4% |
| Maltese | 99.1 /100 | #81 | Exceptional 50.4% |
Demographics Similar to Immigrants from Morocco by Associate's Degree
In terms of associate's degree, the demographic groups most similar to Immigrants from Morocco are Jordanian (49.2%, a difference of 0.13%), Syrian (49.3%, a difference of 0.20%), Austrian (49.1%, a difference of 0.22%), Croatian (49.3%, a difference of 0.23%), and Immigrants from Italy (49.3%, a difference of 0.23%).
| Demographics | Rating | Rank | Associate's Degree |
| Chileans | 97.3 /100 | #102 | Exceptional 49.4% |
| Ukrainians | 97.1 /100 | #103 | Exceptional 49.4% |
| Venezuelans | 97.0 /100 | #104 | Exceptional 49.4% |
| Croatians | 96.8 /100 | #105 | Exceptional 49.3% |
| Immigrants | Italy | 96.7 /100 | #106 | Exceptional 49.3% |
| Syrians | 96.7 /100 | #107 | Exceptional 49.3% |
| Jordanians | 96.6 /100 | #108 | Exceptional 49.2% |
| Immigrants | Morocco | 96.3 /100 | #109 | Exceptional 49.2% |
| Austrians | 95.8 /100 | #110 | Exceptional 49.1% |
| Immigrants | Venezuela | 95.8 /100 | #111 | Exceptional 49.1% |
| Immigrants | Chile | 95.3 /100 | #112 | Exceptional 49.0% |
| Palestinians | 95.3 /100 | #113 | Exceptional 49.0% |
| Arabs | 95.3 /100 | #114 | Exceptional 49.0% |
| Luxembourgers | 95.1 /100 | #115 | Exceptional 48.9% |
| British | 95.0 /100 | #116 | Exceptional 48.9% |