Lithuanian vs Spanish Associate's Degree
COMPARE
Lithuanian
Spanish
Associate's Degree
Associate's Degree Comparison
Lithuanians
Spanish
50.6%
ASSOCIATE'S DEGREE
99.3/ 100
METRIC RATING
74th/ 347
METRIC RANK
44.4%
ASSOCIATE'S DEGREE
9.4/ 100
METRIC RATING
218th/ 347
METRIC RANK
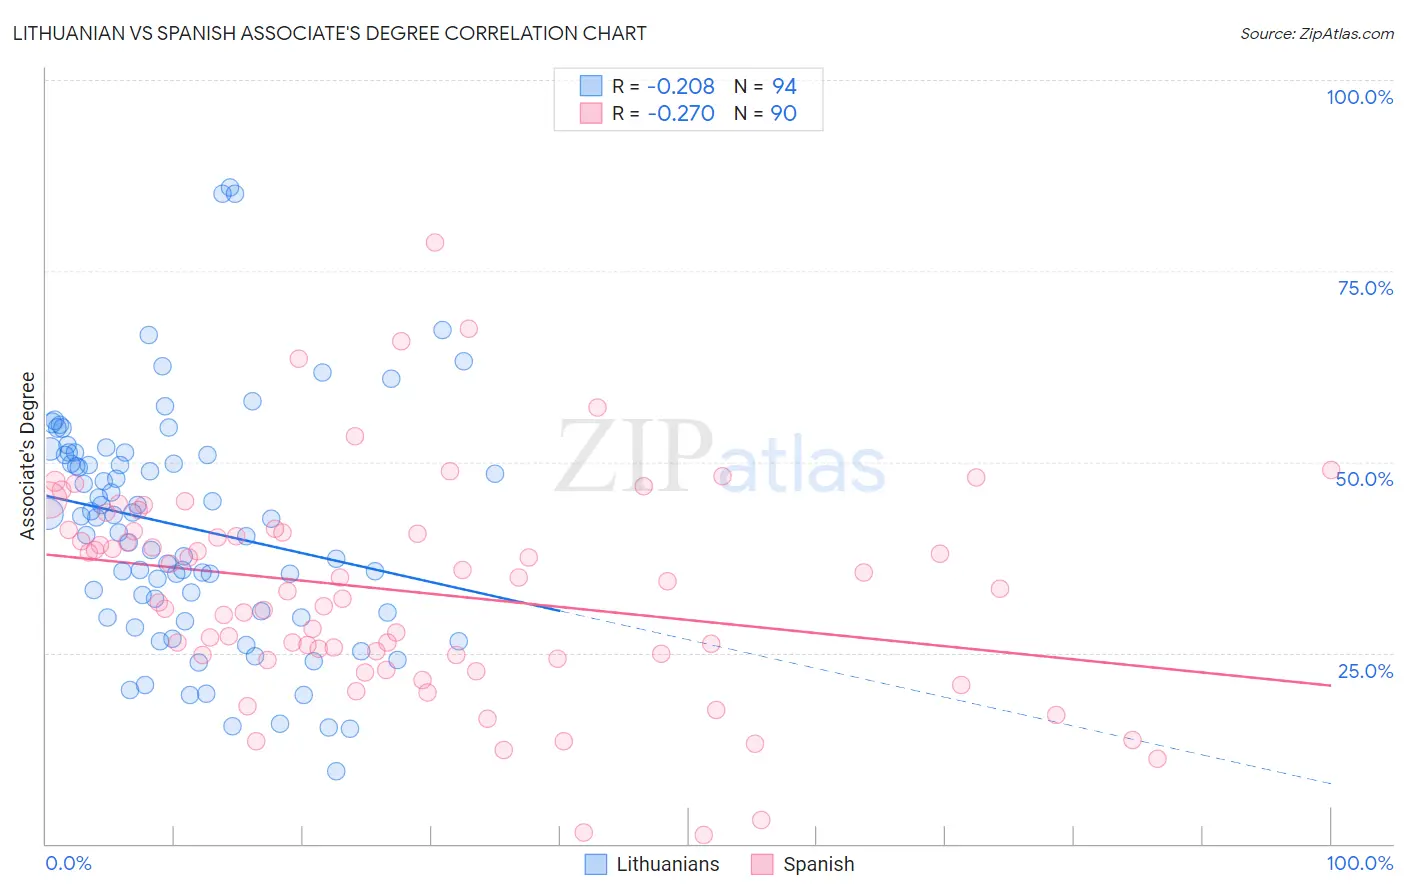
Lithuanian vs Spanish Associate's Degree Correlation Chart
The statistical analysis conducted on geographies consisting of 421,924,512 people shows a weak negative correlation between the proportion of Lithuanians and percentage of population with at least associate's degree education in the United States with a correlation coefficient (R) of -0.208 and weighted average of 50.6%. Similarly, the statistical analysis conducted on geographies consisting of 422,178,546 people shows a weak negative correlation between the proportion of Spanish and percentage of population with at least associate's degree education in the United States with a correlation coefficient (R) of -0.270 and weighted average of 44.4%, a difference of 14.0%.
Associate's Degree Correlation Summary
| Measurement | Lithuanian | Spanish |
| Minimum | 9.5% | 1.2% |
| Maximum | 85.9% | 78.7% |
| Range | 76.4% | 77.5% |
| Mean | 41.4% | 33.1% |
| Median | 42.6% | 33.2% |
| Interquartile 25% (IQ1) | 30.2% | 24.7% |
| Interquartile 75% (IQ3) | 50.9% | 40.9% |
| Interquartile Range (IQR) | 20.7% | 16.2% |
| Standard Deviation (Sample) | 15.3% | 14.1% |
| Standard Deviation (Population) | 15.3% | 14.1% |
Similar Demographics by Associate's Degree
Demographics Similar to Lithuanians by Associate's Degree
In terms of associate's degree, the demographic groups most similar to Lithuanians are Immigrants from Scotland (50.6%, a difference of 0.040%), Carpatho Rusyn (50.6%, a difference of 0.060%), Immigrants from Zimbabwe (50.5%, a difference of 0.25%), Immigrants from Lebanon (50.5%, a difference of 0.28%), and Immigrants from Eastern Europe (50.5%, a difference of 0.33%).
| Demographics | Rating | Rank | Associate's Degree |
| Argentineans | 99.6 /100 | #67 | Exceptional 51.2% |
| Immigrants | Indonesia | 99.5 /100 | #68 | Exceptional 51.0% |
| Egyptians | 99.5 /100 | #69 | Exceptional 50.9% |
| Immigrants | Argentina | 99.5 /100 | #70 | Exceptional 50.9% |
| Immigrants | Romania | 99.5 /100 | #71 | Exceptional 50.9% |
| Immigrants | Pakistan | 99.5 /100 | #72 | Exceptional 50.9% |
| Carpatho Rusyns | 99.3 /100 | #73 | Exceptional 50.6% |
| Lithuanians | 99.3 /100 | #74 | Exceptional 50.6% |
| Immigrants | Scotland | 99.3 /100 | #75 | Exceptional 50.6% |
| Immigrants | Zimbabwe | 99.2 /100 | #76 | Exceptional 50.5% |
| Immigrants | Lebanon | 99.1 /100 | #77 | Exceptional 50.5% |
| Immigrants | Eastern Europe | 99.1 /100 | #78 | Exceptional 50.5% |
| Ethiopians | 99.1 /100 | #79 | Exceptional 50.4% |
| Armenians | 99.1 /100 | #80 | Exceptional 50.4% |
| Maltese | 99.1 /100 | #81 | Exceptional 50.4% |
Demographics Similar to Spanish by Associate's Degree
In terms of associate's degree, the demographic groups most similar to Spanish are Immigrants (44.5%, a difference of 0.25%), Immigrants from Nigeria (44.6%, a difference of 0.43%), White/Caucasian (44.2%, a difference of 0.48%), Portuguese (44.1%, a difference of 0.55%), and Immigrants from Panama (44.7%, a difference of 0.61%).
| Demographics | Rating | Rank | Associate's Degree |
| Immigrants | Zaire | 16.6 /100 | #211 | Poor 45.0% |
| French Canadians | 15.0 /100 | #212 | Poor 44.9% |
| Immigrants | Ghana | 14.2 /100 | #213 | Poor 44.8% |
| Immigrants | Middle Africa | 12.7 /100 | #214 | Poor 44.7% |
| Immigrants | Panama | 12.4 /100 | #215 | Poor 44.7% |
| Immigrants | Nigeria | 11.4 /100 | #216 | Poor 44.6% |
| Immigrants | Immigrants | 10.5 /100 | #217 | Poor 44.5% |
| Spanish | 9.4 /100 | #218 | Tragic 44.4% |
| Whites/Caucasians | 7.5 /100 | #219 | Tragic 44.2% |
| Portuguese | 7.2 /100 | #220 | Tragic 44.1% |
| Immigrants | Western Africa | 6.6 /100 | #221 | Tragic 44.1% |
| Barbadians | 5.8 /100 | #222 | Tragic 43.9% |
| Sub-Saharan Africans | 5.5 /100 | #223 | Tragic 43.9% |
| West Indians | 5.2 /100 | #224 | Tragic 43.8% |
| Guamanians/Chamorros | 4.8 /100 | #225 | Tragic 43.8% |