Lithuanian vs Immigrants from Kazakhstan Associate's Degree
COMPARE
Lithuanian
Immigrants from Kazakhstan
Associate's Degree
Associate's Degree Comparison
Lithuanians
Immigrants from Kazakhstan
50.6%
ASSOCIATE'S DEGREE
99.3/ 100
METRIC RATING
74th/ 347
METRIC RANK
51.4%
ASSOCIATE'S DEGREE
99.7/ 100
METRIC RATING
61st/ 347
METRIC RANK
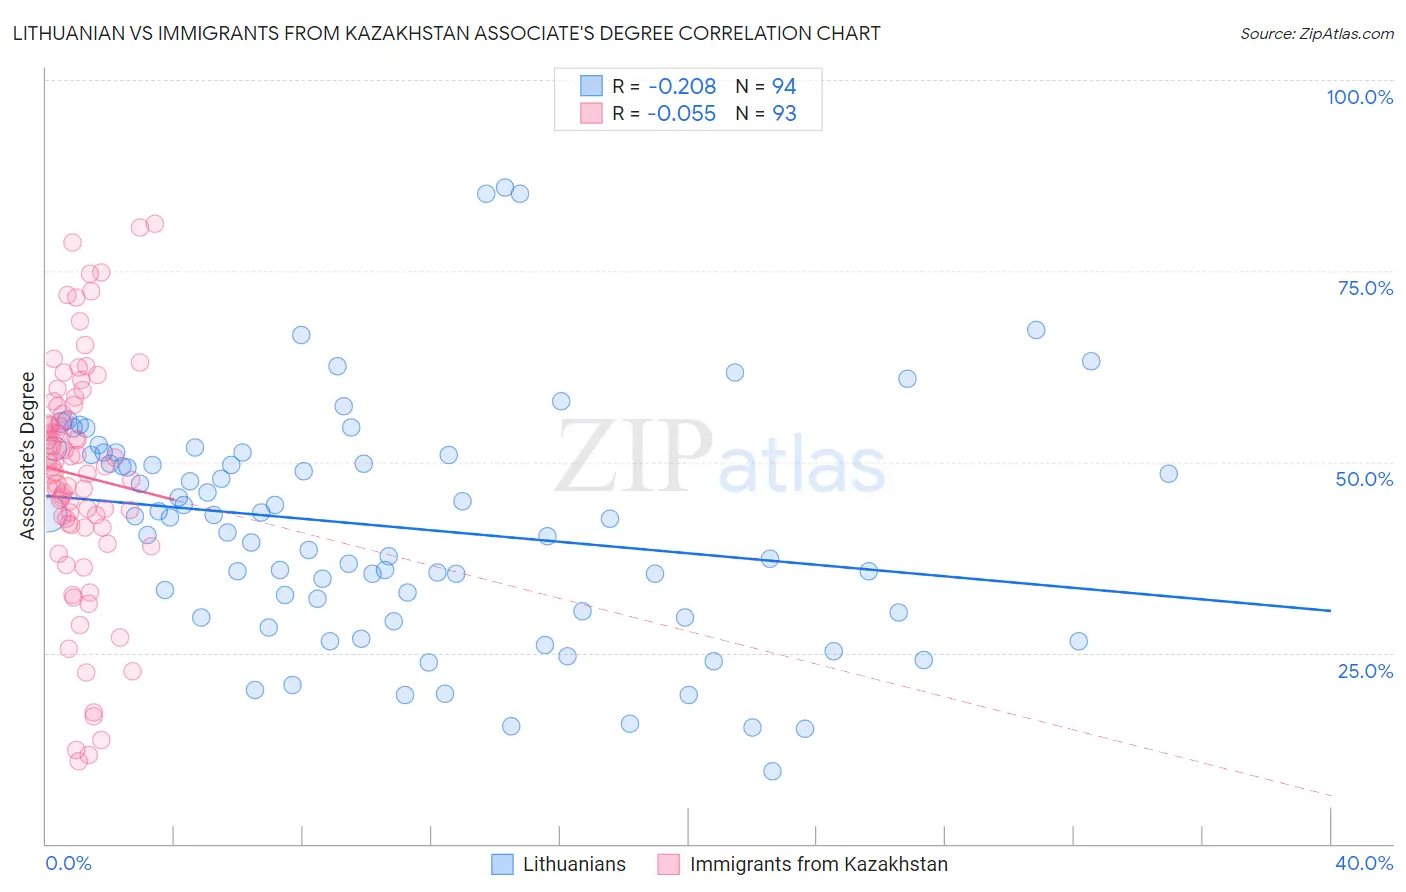
Lithuanian vs Immigrants from Kazakhstan Associate's Degree Correlation Chart
The statistical analysis conducted on geographies consisting of 421,924,512 people shows a weak negative correlation between the proportion of Lithuanians and percentage of population with at least associate's degree education in the United States with a correlation coefficient (R) of -0.208 and weighted average of 50.6%. Similarly, the statistical analysis conducted on geographies consisting of 124,444,388 people shows a slight negative correlation between the proportion of Immigrants from Kazakhstan and percentage of population with at least associate's degree education in the United States with a correlation coefficient (R) of -0.055 and weighted average of 51.4%, a difference of 1.6%.
Associate's Degree Correlation Summary
| Measurement | Lithuanian | Immigrants from Kazakhstan |
| Minimum | 9.5% | 10.8% |
| Maximum | 85.9% | 81.2% |
| Range | 76.4% | 70.3% |
| Mean | 41.4% | 48.3% |
| Median | 42.6% | 49.4% |
| Interquartile 25% (IQ1) | 30.2% | 41.8% |
| Interquartile 75% (IQ3) | 50.9% | 56.8% |
| Interquartile Range (IQR) | 20.7% | 15.0% |
| Standard Deviation (Sample) | 15.3% | 15.2% |
| Standard Deviation (Population) | 15.3% | 15.1% |
Demographics Similar to Lithuanians and Immigrants from Kazakhstan by Associate's Degree
In terms of associate's degree, the demographic groups most similar to Lithuanians are Immigrants from Scotland (50.6%, a difference of 0.040%), Carpatho Rusyn (50.6%, a difference of 0.060%), Immigrants from Zimbabwe (50.5%, a difference of 0.25%), Immigrants from Lebanon (50.5%, a difference of 0.28%), and Immigrants from Pakistan (50.9%, a difference of 0.52%). Similarly, the demographic groups most similar to Immigrants from Kazakhstan are Bhutanese (51.4%, a difference of 0.0%), South African (51.4%, a difference of 0.060%), Immigrants from Netherlands (51.4%, a difference of 0.13%), Immigrants from Bolivia (51.5%, a difference of 0.15%), and Zimbabwean (51.3%, a difference of 0.16%).
| Demographics | Rating | Rank | Associate's Degree |
| Paraguayans | 99.8 /100 | #57 | Exceptional 51.8% |
| New Zealanders | 99.8 /100 | #58 | Exceptional 51.8% |
| Immigrants | Serbia | 99.8 /100 | #59 | Exceptional 51.7% |
| Immigrants | Bolivia | 99.7 /100 | #60 | Exceptional 51.5% |
| Immigrants | Kazakhstan | 99.7 /100 | #61 | Exceptional 51.4% |
| Bhutanese | 99.7 /100 | #62 | Exceptional 51.4% |
| South Africans | 99.7 /100 | #63 | Exceptional 51.4% |
| Immigrants | Netherlands | 99.7 /100 | #64 | Exceptional 51.4% |
| Zimbabweans | 99.7 /100 | #65 | Exceptional 51.3% |
| Immigrants | Europe | 99.7 /100 | #66 | Exceptional 51.3% |
| Argentineans | 99.6 /100 | #67 | Exceptional 51.2% |
| Immigrants | Indonesia | 99.5 /100 | #68 | Exceptional 51.0% |
| Egyptians | 99.5 /100 | #69 | Exceptional 50.9% |
| Immigrants | Argentina | 99.5 /100 | #70 | Exceptional 50.9% |
| Immigrants | Romania | 99.5 /100 | #71 | Exceptional 50.9% |
| Immigrants | Pakistan | 99.5 /100 | #72 | Exceptional 50.9% |
| Carpatho Rusyns | 99.3 /100 | #73 | Exceptional 50.6% |
| Lithuanians | 99.3 /100 | #74 | Exceptional 50.6% |
| Immigrants | Scotland | 99.3 /100 | #75 | Exceptional 50.6% |
| Immigrants | Zimbabwe | 99.2 /100 | #76 | Exceptional 50.5% |
| Immigrants | Lebanon | 99.1 /100 | #77 | Exceptional 50.5% |