Lithuanian vs British West Indian Bachelor's Degree
COMPARE
Lithuanian
British West Indian
Bachelor's Degree
Bachelor's Degree Comparison
Lithuanians
British West Indians
42.2%
BACHELOR'S DEGREE
99.2/ 100
METRIC RATING
85th/ 347
METRIC RANK
34.5%
BACHELOR'S DEGREE
2.5/ 100
METRIC RATING
239th/ 347
METRIC RANK
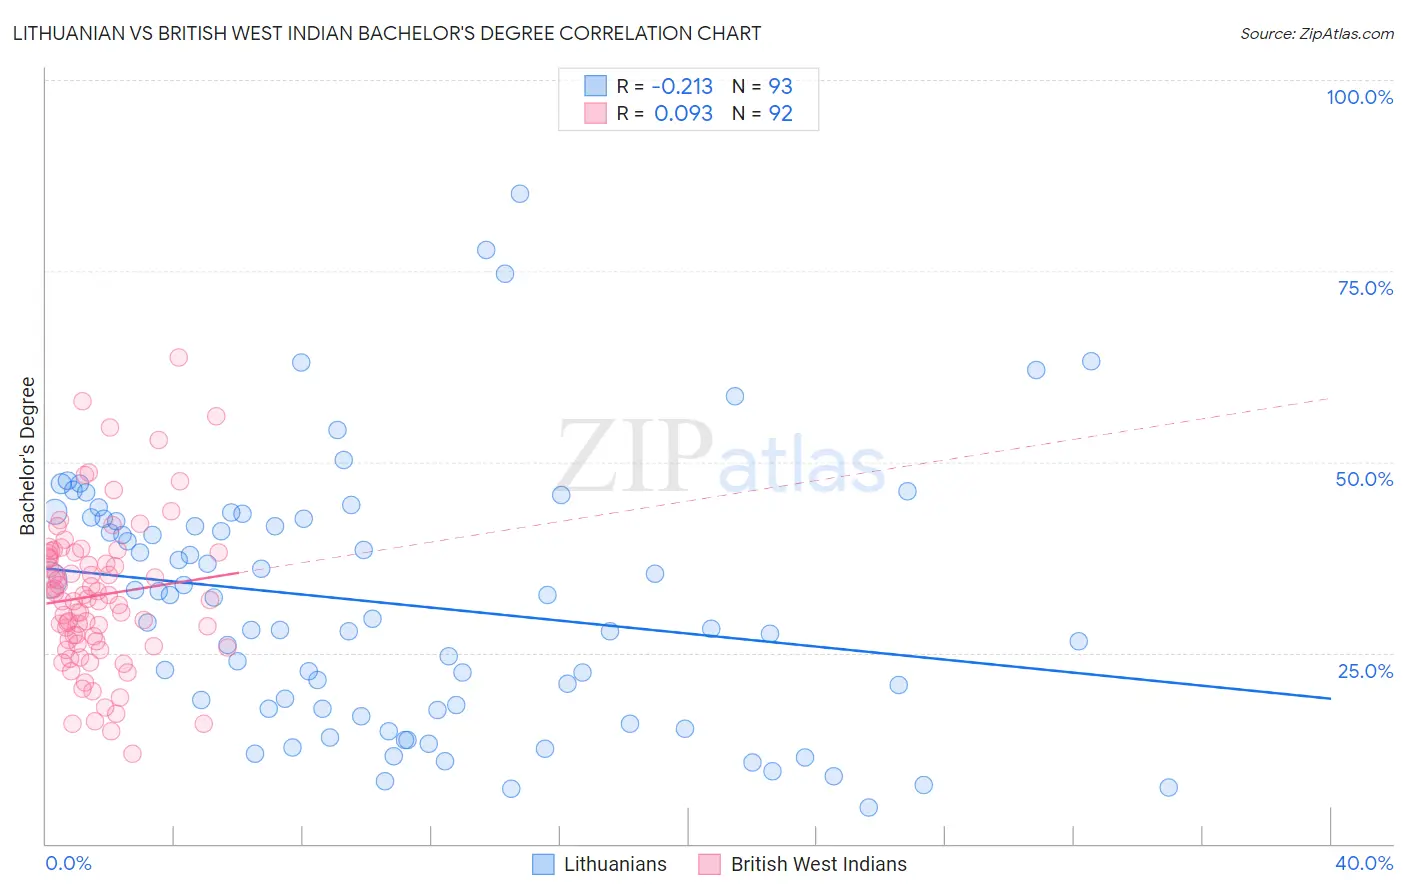
Lithuanian vs British West Indian Bachelor's Degree Correlation Chart
The statistical analysis conducted on geographies consisting of 421,915,203 people shows a weak negative correlation between the proportion of Lithuanians and percentage of population with at least bachelor's degree education in the United States with a correlation coefficient (R) of -0.213 and weighted average of 42.2%. Similarly, the statistical analysis conducted on geographies consisting of 152,683,655 people shows a slight positive correlation between the proportion of British West Indians and percentage of population with at least bachelor's degree education in the United States with a correlation coefficient (R) of 0.093 and weighted average of 34.5%, a difference of 22.6%.
Bachelor's Degree Correlation Summary
| Measurement | Lithuanian | British West Indian |
| Minimum | 4.7% | 11.8% |
| Maximum | 85.2% | 63.7% |
| Range | 80.5% | 51.9% |
| Mean | 31.4% | 32.5% |
| Median | 29.4% | 32.0% |
| Interquartile 25% (IQ1) | 17.6% | 26.4% |
| Interquartile 75% (IQ3) | 42.5% | 38.0% |
| Interquartile Range (IQR) | 25.0% | 11.6% |
| Standard Deviation (Sample) | 16.9% | 9.8% |
| Standard Deviation (Population) | 16.8% | 9.7% |
Similar Demographics by Bachelor's Degree
Demographics Similar to Lithuanians by Bachelor's Degree
In terms of bachelor's degree, the demographic groups most similar to Lithuanians are Immigrants from Western Asia (42.3%, a difference of 0.030%), Armenian (42.3%, a difference of 0.040%), Immigrants from Scotland (42.3%, a difference of 0.070%), Immigrants from Brazil (42.2%, a difference of 0.080%), and Immigrants from Hungary (42.3%, a difference of 0.14%).
| Demographics | Rating | Rank | Bachelor's Degree |
| Immigrants | Ethiopia | 99.4 /100 | #78 | Exceptional 42.5% |
| Immigrants | Lebanon | 99.3 /100 | #79 | Exceptional 42.4% |
| Immigrants | Croatia | 99.2 /100 | #80 | Exceptional 42.3% |
| Immigrants | Hungary | 99.2 /100 | #81 | Exceptional 42.3% |
| Immigrants | Scotland | 99.2 /100 | #82 | Exceptional 42.3% |
| Armenians | 99.2 /100 | #83 | Exceptional 42.3% |
| Immigrants | Western Asia | 99.2 /100 | #84 | Exceptional 42.3% |
| Lithuanians | 99.2 /100 | #85 | Exceptional 42.2% |
| Immigrants | Brazil | 99.2 /100 | #86 | Exceptional 42.2% |
| Carpatho Rusyns | 99.0 /100 | #87 | Exceptional 42.1% |
| Immigrants | Western Europe | 99.0 /100 | #88 | Exceptional 42.0% |
| Greeks | 99.0 /100 | #89 | Exceptional 42.0% |
| Laotians | 98.9 /100 | #90 | Exceptional 42.0% |
| Immigrants | Northern Africa | 98.9 /100 | #91 | Exceptional 41.9% |
| Maltese | 98.8 /100 | #92 | Exceptional 41.9% |
Demographics Similar to British West Indians by Bachelor's Degree
In terms of bachelor's degree, the demographic groups most similar to British West Indians are Guyanese (34.5%, a difference of 0.020%), Tlingit-Haida (34.6%, a difference of 0.30%), Liberian (34.6%, a difference of 0.34%), Immigrants from West Indies (34.6%, a difference of 0.45%), and Guamanian/Chamorro (34.6%, a difference of 0.54%).
| Demographics | Rating | Rank | Bachelor's Degree |
| Hmong | 3.4 /100 | #232 | Tragic 34.8% |
| Immigrants | Ecuador | 3.3 /100 | #233 | Tragic 34.7% |
| Guamanians/Chamorros | 3.0 /100 | #234 | Tragic 34.6% |
| Immigrants | West Indies | 2.9 /100 | #235 | Tragic 34.6% |
| Liberians | 2.8 /100 | #236 | Tragic 34.6% |
| Tlingit-Haida | 2.8 /100 | #237 | Tragic 34.6% |
| Guyanese | 2.5 /100 | #238 | Tragic 34.5% |
| British West Indians | 2.5 /100 | #239 | Tragic 34.5% |
| Tongans | 2.0 /100 | #240 | Tragic 34.3% |
| Immigrants | Cambodia | 1.9 /100 | #241 | Tragic 34.2% |
| Immigrants | Nonimmigrants | 1.8 /100 | #242 | Tragic 34.2% |
| Immigrants | Guyana | 1.4 /100 | #243 | Tragic 33.9% |
| Delaware | 1.2 /100 | #244 | Tragic 33.8% |
| Immigrants | Fiji | 1.2 /100 | #245 | Tragic 33.7% |
| Jamaicans | 1.0 /100 | #246 | Tragic 33.6% |