French American Indian vs British West Indian Bachelor's Degree
COMPARE
French American Indian
British West Indian
Bachelor's Degree
Bachelor's Degree Comparison
French American Indians
British West Indians
33.1%
BACHELOR'S DEGREE
0.6/ 100
METRIC RATING
258th/ 347
METRIC RANK
34.5%
BACHELOR'S DEGREE
2.5/ 100
METRIC RATING
239th/ 347
METRIC RANK
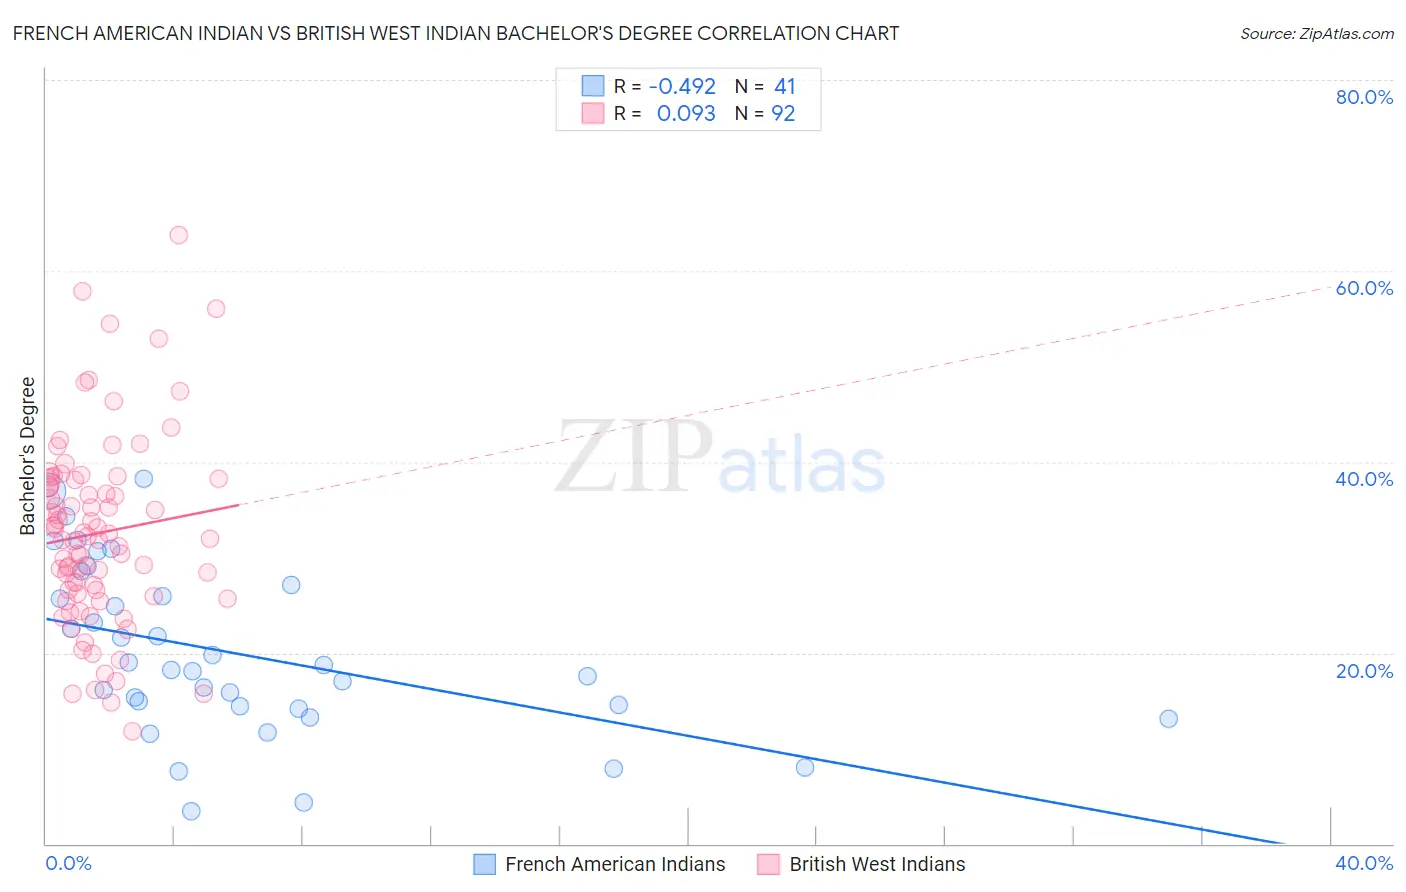
French American Indian vs British West Indian Bachelor's Degree Correlation Chart
The statistical analysis conducted on geographies consisting of 131,974,531 people shows a moderate negative correlation between the proportion of French American Indians and percentage of population with at least bachelor's degree education in the United States with a correlation coefficient (R) of -0.492 and weighted average of 33.1%. Similarly, the statistical analysis conducted on geographies consisting of 152,683,655 people shows a slight positive correlation between the proportion of British West Indians and percentage of population with at least bachelor's degree education in the United States with a correlation coefficient (R) of 0.093 and weighted average of 34.5%, a difference of 4.2%.
Bachelor's Degree Correlation Summary
| Measurement | French American Indian | British West Indian |
| Minimum | 3.4% | 11.8% |
| Maximum | 38.2% | 63.7% |
| Range | 34.8% | 51.9% |
| Mean | 19.9% | 32.5% |
| Median | 18.3% | 32.0% |
| Interquartile 25% (IQ1) | 14.3% | 26.4% |
| Interquartile 75% (IQ3) | 26.5% | 38.0% |
| Interquartile Range (IQR) | 12.3% | 11.6% |
| Standard Deviation (Sample) | 8.8% | 9.8% |
| Standard Deviation (Population) | 8.6% | 9.7% |
Demographics Similar to French American Indians and British West Indians by Bachelor's Degree
In terms of bachelor's degree, the demographic groups most similar to French American Indians are Spanish American (33.1%, a difference of 0.040%), Nicaraguan (33.1%, a difference of 0.26%), Iroquois (33.2%, a difference of 0.45%), Native Hawaiian (33.2%, a difference of 0.47%), and U.S. Virgin Islander (33.2%, a difference of 0.53%). Similarly, the demographic groups most similar to British West Indians are Guyanese (34.5%, a difference of 0.020%), Tongan (34.3%, a difference of 0.54%), Immigrants from Cambodia (34.2%, a difference of 0.80%), Nonimmigrants (34.2%, a difference of 0.87%), and Immigrants from Guyana (33.9%, a difference of 1.5%).
| Demographics | Rating | Rank | Bachelor's Degree |
| Guyanese | 2.5 /100 | #238 | Tragic 34.5% |
| British West Indians | 2.5 /100 | #239 | Tragic 34.5% |
| Tongans | 2.0 /100 | #240 | Tragic 34.3% |
| Immigrants | Cambodia | 1.9 /100 | #241 | Tragic 34.2% |
| Immigrants | Nonimmigrants | 1.8 /100 | #242 | Tragic 34.2% |
| Immigrants | Guyana | 1.4 /100 | #243 | Tragic 33.9% |
| Delaware | 1.2 /100 | #244 | Tragic 33.8% |
| Immigrants | Fiji | 1.2 /100 | #245 | Tragic 33.7% |
| Jamaicans | 1.0 /100 | #246 | Tragic 33.6% |
| Immigrants | Congo | 1.0 /100 | #247 | Tragic 33.6% |
| Cree | 1.0 /100 | #248 | Tragic 33.6% |
| Immigrants | Liberia | 0.9 /100 | #249 | Tragic 33.5% |
| Indonesians | 0.9 /100 | #250 | Tragic 33.5% |
| Japanese | 0.7 /100 | #251 | Tragic 33.3% |
| Immigrants | Bahamas | 0.7 /100 | #252 | Tragic 33.3% |
| U.S. Virgin Islanders | 0.7 /100 | #253 | Tragic 33.2% |
| Native Hawaiians | 0.7 /100 | #254 | Tragic 33.2% |
| Iroquois | 0.7 /100 | #255 | Tragic 33.2% |
| Nicaraguans | 0.6 /100 | #256 | Tragic 33.1% |
| Spanish Americans | 0.6 /100 | #257 | Tragic 33.1% |
| French American Indians | 0.6 /100 | #258 | Tragic 33.1% |