American vs British West Indian Bachelor's Degree
COMPARE
American
British West Indian
Bachelor's Degree
Bachelor's Degree Comparison
Americans
British West Indians
31.9%
BACHELOR'S DEGREE
0.2/ 100
METRIC RATING
273rd/ 347
METRIC RANK
34.5%
BACHELOR'S DEGREE
2.5/ 100
METRIC RATING
239th/ 347
METRIC RANK
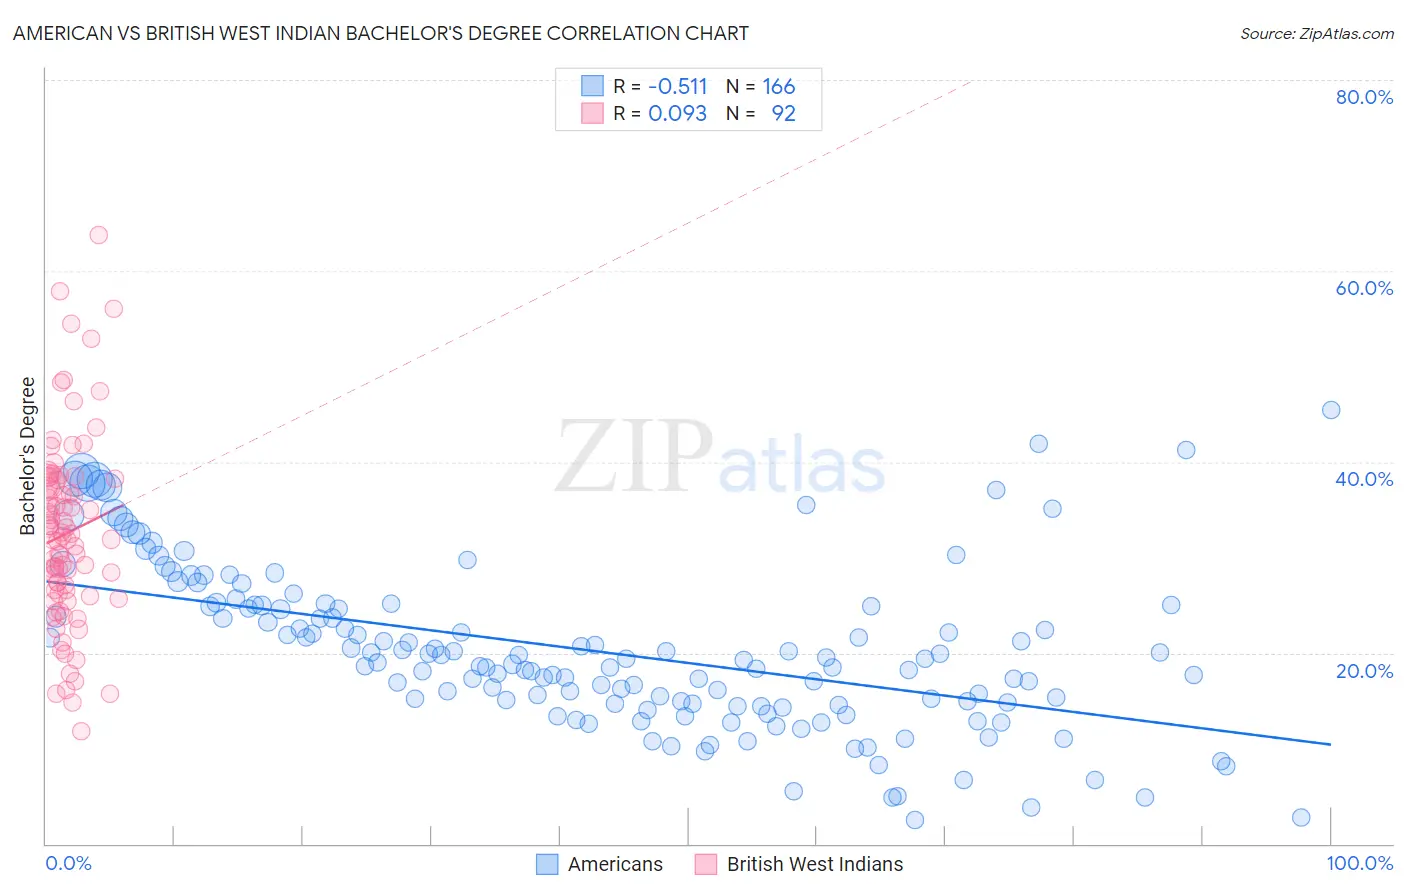
American vs British West Indian Bachelor's Degree Correlation Chart
The statistical analysis conducted on geographies consisting of 581,681,572 people shows a substantial negative correlation between the proportion of Americans and percentage of population with at least bachelor's degree education in the United States with a correlation coefficient (R) of -0.511 and weighted average of 31.9%. Similarly, the statistical analysis conducted on geographies consisting of 152,683,655 people shows a slight positive correlation between the proportion of British West Indians and percentage of population with at least bachelor's degree education in the United States with a correlation coefficient (R) of 0.093 and weighted average of 34.5%, a difference of 8.1%.
Bachelor's Degree Correlation Summary
| Measurement | American | British West Indian |
| Minimum | 2.5% | 11.8% |
| Maximum | 45.5% | 63.7% |
| Range | 43.0% | 51.9% |
| Mean | 20.2% | 32.5% |
| Median | 19.3% | 32.0% |
| Interquartile 25% (IQ1) | 14.6% | 26.4% |
| Interquartile 75% (IQ3) | 24.9% | 38.0% |
| Interquartile Range (IQR) | 10.3% | 11.6% |
| Standard Deviation (Sample) | 8.5% | 9.8% |
| Standard Deviation (Population) | 8.5% | 9.7% |
Similar Demographics by Bachelor's Degree
Demographics Similar to Americans by Bachelor's Degree
In terms of bachelor's degree, the demographic groups most similar to Americans are Potawatomi (31.9%, a difference of 0.020%), Comanche (31.9%, a difference of 0.12%), Central American (31.9%, a difference of 0.15%), Samoan (31.8%, a difference of 0.15%), and Salvadoran (31.8%, a difference of 0.19%).
| Demographics | Rating | Rank | Bachelor's Degree |
| Immigrants | Dominica | 0.3 /100 | #266 | Tragic 32.5% |
| Cubans | 0.3 /100 | #267 | Tragic 32.5% |
| Immigrants | Portugal | 0.2 /100 | #268 | Tragic 32.2% |
| Immigrants | Belize | 0.2 /100 | #269 | Tragic 32.1% |
| Immigrants | Nicaragua | 0.2 /100 | #270 | Tragic 31.9% |
| Central Americans | 0.2 /100 | #271 | Tragic 31.9% |
| Comanche | 0.2 /100 | #272 | Tragic 31.9% |
| Americans | 0.2 /100 | #273 | Tragic 31.9% |
| Potawatomi | 0.2 /100 | #274 | Tragic 31.9% |
| Samoans | 0.1 /100 | #275 | Tragic 31.8% |
| Salvadorans | 0.1 /100 | #276 | Tragic 31.8% |
| Dominicans | 0.1 /100 | #277 | Tragic 31.8% |
| Marshallese | 0.1 /100 | #278 | Tragic 31.7% |
| Hawaiians | 0.1 /100 | #279 | Tragic 31.6% |
| Immigrants | Laos | 0.1 /100 | #280 | Tragic 31.6% |
Demographics Similar to British West Indians by Bachelor's Degree
In terms of bachelor's degree, the demographic groups most similar to British West Indians are Guyanese (34.5%, a difference of 0.020%), Tlingit-Haida (34.6%, a difference of 0.30%), Liberian (34.6%, a difference of 0.34%), Immigrants from West Indies (34.6%, a difference of 0.45%), and Guamanian/Chamorro (34.6%, a difference of 0.54%).
| Demographics | Rating | Rank | Bachelor's Degree |
| Hmong | 3.4 /100 | #232 | Tragic 34.8% |
| Immigrants | Ecuador | 3.3 /100 | #233 | Tragic 34.7% |
| Guamanians/Chamorros | 3.0 /100 | #234 | Tragic 34.6% |
| Immigrants | West Indies | 2.9 /100 | #235 | Tragic 34.6% |
| Liberians | 2.8 /100 | #236 | Tragic 34.6% |
| Tlingit-Haida | 2.8 /100 | #237 | Tragic 34.6% |
| Guyanese | 2.5 /100 | #238 | Tragic 34.5% |
| British West Indians | 2.5 /100 | #239 | Tragic 34.5% |
| Tongans | 2.0 /100 | #240 | Tragic 34.3% |
| Immigrants | Cambodia | 1.9 /100 | #241 | Tragic 34.2% |
| Immigrants | Nonimmigrants | 1.8 /100 | #242 | Tragic 34.2% |
| Immigrants | Guyana | 1.4 /100 | #243 | Tragic 33.9% |
| Delaware | 1.2 /100 | #244 | Tragic 33.8% |
| Immigrants | Fiji | 1.2 /100 | #245 | Tragic 33.7% |
| Jamaicans | 1.0 /100 | #246 | Tragic 33.6% |