Lithuanian vs British West Indian 11th Grade
COMPARE
Lithuanian
British West Indian
11th Grade
11th Grade Comparison
Lithuanians
British West Indians
94.8%
11TH GRADE
100.0/ 100
METRIC RATING
6th/ 347
METRIC RANK
90.3%
11TH GRADE
0.0/ 100
METRIC RATING
289th/ 347
METRIC RANK
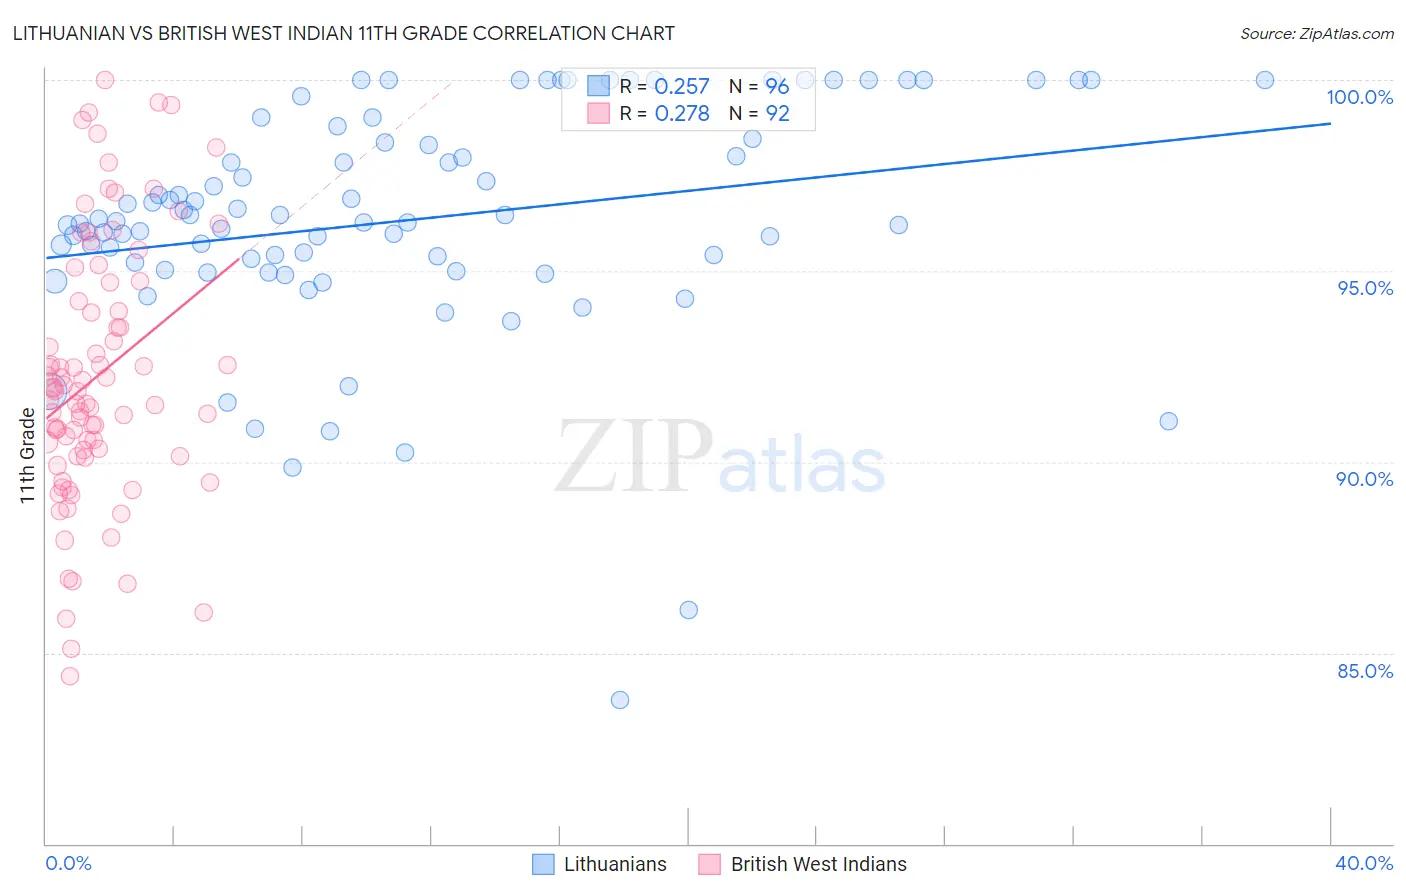
Lithuanian vs British West Indian 11th Grade Correlation Chart
The statistical analysis conducted on geographies consisting of 421,947,832 people shows a weak positive correlation between the proportion of Lithuanians and percentage of population with at least 11th grade education in the United States with a correlation coefficient (R) of 0.257 and weighted average of 94.8%. Similarly, the statistical analysis conducted on geographies consisting of 152,691,173 people shows a weak positive correlation between the proportion of British West Indians and percentage of population with at least 11th grade education in the United States with a correlation coefficient (R) of 0.278 and weighted average of 90.3%, a difference of 5.0%.
11th Grade Correlation Summary
| Measurement | Lithuanian | British West Indian |
| Minimum | 83.8% | 84.4% |
| Maximum | 100.0% | 100.0% |
| Range | 16.2% | 15.6% |
| Mean | 96.3% | 92.3% |
| Median | 96.3% | 91.9% |
| Interquartile 25% (IQ1) | 95.1% | 90.2% |
| Interquartile 75% (IQ3) | 98.4% | 94.4% |
| Interquartile Range (IQR) | 3.3% | 4.2% |
| Standard Deviation (Sample) | 3.0% | 3.4% |
| Standard Deviation (Population) | 3.0% | 3.4% |
Similar Demographics by 11th Grade
Demographics Similar to Lithuanians by 11th Grade
In terms of 11th grade, the demographic groups most similar to Lithuanians are Carpatho Rusyn (94.8%, a difference of 0.050%), Polish (94.8%, a difference of 0.050%), Croatian (94.7%, a difference of 0.060%), Danish (94.7%, a difference of 0.10%), and Slovak (94.9%, a difference of 0.11%).
| Demographics | Rating | Rank | 11th Grade |
| Norwegians | 100.0 /100 | #1 | Exceptional 95.2% |
| Swedes | 100.0 /100 | #2 | Exceptional 94.9% |
| Slovenes | 100.0 /100 | #3 | Exceptional 94.9% |
| Slovaks | 100.0 /100 | #4 | Exceptional 94.9% |
| Carpatho Rusyns | 100.0 /100 | #5 | Exceptional 94.8% |
| Lithuanians | 100.0 /100 | #6 | Exceptional 94.8% |
| Poles | 100.0 /100 | #7 | Exceptional 94.8% |
| Croatians | 100.0 /100 | #8 | Exceptional 94.7% |
| Danes | 100.0 /100 | #9 | Exceptional 94.7% |
| Finns | 100.0 /100 | #10 | Exceptional 94.7% |
| Germans | 100.0 /100 | #11 | Exceptional 94.7% |
| Latvians | 100.0 /100 | #12 | Exceptional 94.7% |
| Chinese | 100.0 /100 | #13 | Exceptional 94.6% |
| Eastern Europeans | 100.0 /100 | #14 | Exceptional 94.6% |
| Bulgarians | 100.0 /100 | #15 | Exceptional 94.5% |
Demographics Similar to British West Indians by 11th Grade
In terms of 11th grade, the demographic groups most similar to British West Indians are Pennsylvania German (90.3%, a difference of 0.020%), Indonesian (90.3%, a difference of 0.020%), Immigrants from West Indies (90.4%, a difference of 0.050%), Apache (90.4%, a difference of 0.050%), and Haitian (90.3%, a difference of 0.060%).
| Demographics | Rating | Rank | 11th Grade |
| Immigrants | St. Vincent and the Grenadines | 0.0 /100 | #282 | Tragic 90.7% |
| Immigrants | Barbados | 0.0 /100 | #283 | Tragic 90.7% |
| Immigrants | Laos | 0.0 /100 | #284 | Tragic 90.5% |
| Immigrants | Burma/Myanmar | 0.0 /100 | #285 | Tragic 90.4% |
| Immigrants | West Indies | 0.0 /100 | #286 | Tragic 90.4% |
| Apache | 0.0 /100 | #287 | Tragic 90.4% |
| Pennsylvania Germans | 0.0 /100 | #288 | Tragic 90.3% |
| British West Indians | 0.0 /100 | #289 | Tragic 90.3% |
| Indonesians | 0.0 /100 | #290 | Tragic 90.3% |
| Haitians | 0.0 /100 | #291 | Tragic 90.3% |
| Cubans | 0.0 /100 | #292 | Tragic 90.2% |
| Natives/Alaskans | 0.0 /100 | #293 | Tragic 90.2% |
| Immigrants | Grenada | 0.0 /100 | #294 | Tragic 90.1% |
| Immigrants | Vietnam | 0.0 /100 | #295 | Tragic 90.0% |
| Fijians | 0.0 /100 | #296 | Tragic 90.0% |