Lithuanian vs Swedish Bachelor's Degree
COMPARE
Lithuanian
Swedish
Bachelor's Degree
Bachelor's Degree Comparison
Lithuanians
Swedes
42.2%
BACHELOR'S DEGREE
99.2/ 100
METRIC RATING
85th/ 347
METRIC RANK
39.1%
BACHELOR'S DEGREE
79.2/ 100
METRIC RATING
146th/ 347
METRIC RANK
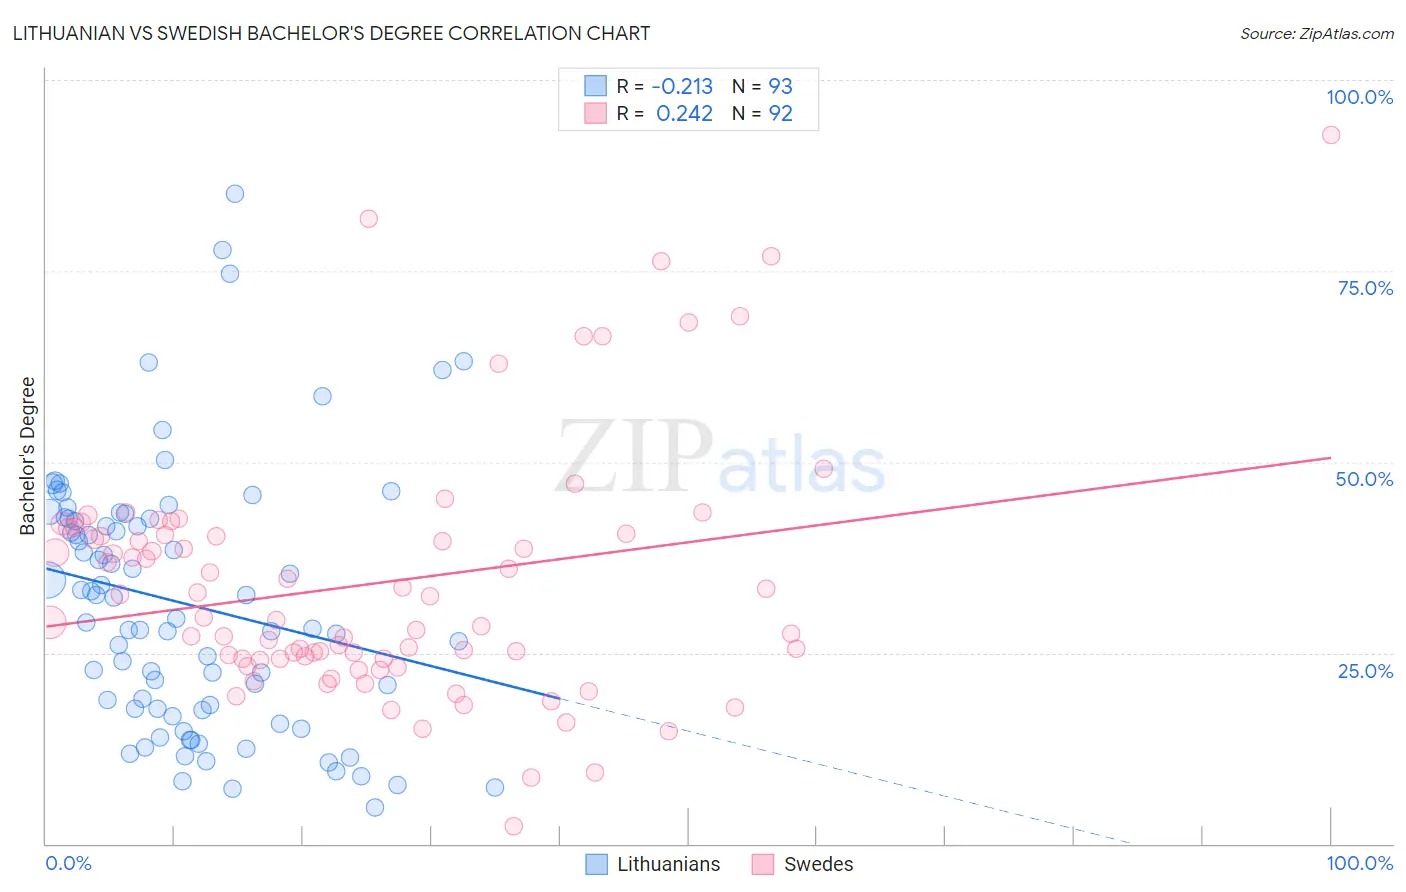
Lithuanian vs Swedish Bachelor's Degree Correlation Chart
The statistical analysis conducted on geographies consisting of 421,915,203 people shows a weak negative correlation between the proportion of Lithuanians and percentage of population with at least bachelor's degree education in the United States with a correlation coefficient (R) of -0.213 and weighted average of 42.2%. Similarly, the statistical analysis conducted on geographies consisting of 539,155,102 people shows a weak positive correlation between the proportion of Swedes and percentage of population with at least bachelor's degree education in the United States with a correlation coefficient (R) of 0.242 and weighted average of 39.1%, a difference of 8.2%.
Bachelor's Degree Correlation Summary
| Measurement | Lithuanian | Swedish |
| Minimum | 4.7% | 2.3% |
| Maximum | 85.2% | 92.9% |
| Range | 80.5% | 90.6% |
| Mean | 31.4% | 34.1% |
| Median | 29.4% | 29.4% |
| Interquartile 25% (IQ1) | 17.6% | 24.2% |
| Interquartile 75% (IQ3) | 42.5% | 40.5% |
| Interquartile Range (IQR) | 25.0% | 16.3% |
| Standard Deviation (Sample) | 16.9% | 16.3% |
| Standard Deviation (Population) | 16.8% | 16.2% |
Similar Demographics by Bachelor's Degree
Demographics Similar to Lithuanians by Bachelor's Degree
In terms of bachelor's degree, the demographic groups most similar to Lithuanians are Immigrants from Western Asia (42.3%, a difference of 0.030%), Armenian (42.3%, a difference of 0.040%), Immigrants from Scotland (42.3%, a difference of 0.070%), Immigrants from Brazil (42.2%, a difference of 0.080%), and Immigrants from Hungary (42.3%, a difference of 0.14%).
| Demographics | Rating | Rank | Bachelor's Degree |
| Immigrants | Ethiopia | 99.4 /100 | #78 | Exceptional 42.5% |
| Immigrants | Lebanon | 99.3 /100 | #79 | Exceptional 42.4% |
| Immigrants | Croatia | 99.2 /100 | #80 | Exceptional 42.3% |
| Immigrants | Hungary | 99.2 /100 | #81 | Exceptional 42.3% |
| Immigrants | Scotland | 99.2 /100 | #82 | Exceptional 42.3% |
| Armenians | 99.2 /100 | #83 | Exceptional 42.3% |
| Immigrants | Western Asia | 99.2 /100 | #84 | Exceptional 42.3% |
| Lithuanians | 99.2 /100 | #85 | Exceptional 42.2% |
| Immigrants | Brazil | 99.2 /100 | #86 | Exceptional 42.2% |
| Carpatho Rusyns | 99.0 /100 | #87 | Exceptional 42.1% |
| Immigrants | Western Europe | 99.0 /100 | #88 | Exceptional 42.0% |
| Greeks | 99.0 /100 | #89 | Exceptional 42.0% |
| Laotians | 98.9 /100 | #90 | Exceptional 42.0% |
| Immigrants | Northern Africa | 98.9 /100 | #91 | Exceptional 41.9% |
| Maltese | 98.8 /100 | #92 | Exceptional 41.9% |
Demographics Similar to Swedes by Bachelor's Degree
In terms of bachelor's degree, the demographic groups most similar to Swedes are Immigrants from Sierra Leone (39.0%, a difference of 0.030%), Slovene (39.1%, a difference of 0.040%), Immigrants from Afghanistan (39.1%, a difference of 0.070%), Polish (39.1%, a difference of 0.090%), and Iraqi (39.0%, a difference of 0.17%).
| Demographics | Rating | Rank | Bachelor's Degree |
| Immigrants | Sudan | 84.5 /100 | #139 | Excellent 39.4% |
| Immigrants | Armenia | 84.1 /100 | #140 | Excellent 39.4% |
| South American Indians | 83.6 /100 | #141 | Excellent 39.3% |
| Immigrants | North Macedonia | 81.6 /100 | #142 | Excellent 39.2% |
| Poles | 79.8 /100 | #143 | Good 39.1% |
| Immigrants | Afghanistan | 79.7 /100 | #144 | Good 39.1% |
| Slovenes | 79.5 /100 | #145 | Good 39.1% |
| Swedes | 79.2 /100 | #146 | Good 39.1% |
| Immigrants | Sierra Leone | 79.0 /100 | #147 | Good 39.0% |
| Iraqis | 78.1 /100 | #148 | Good 39.0% |
| Immigrants | Poland | 77.5 /100 | #149 | Good 39.0% |
| South Americans | 77.3 /100 | #150 | Good 38.9% |
| Immigrants | Africa | 76.5 /100 | #151 | Good 38.9% |
| Sudanese | 76.4 /100 | #152 | Good 38.9% |
| Slavs | 75.9 /100 | #153 | Good 38.9% |