Lithuanian vs Finnish Bachelor's Degree
COMPARE
Lithuanian
Finnish
Bachelor's Degree
Bachelor's Degree Comparison
Lithuanians
Finns
42.2%
BACHELOR'S DEGREE
99.2/ 100
METRIC RATING
85th/ 347
METRIC RANK
36.7%
BACHELOR'S DEGREE
22.2/ 100
METRIC RATING
205th/ 347
METRIC RANK
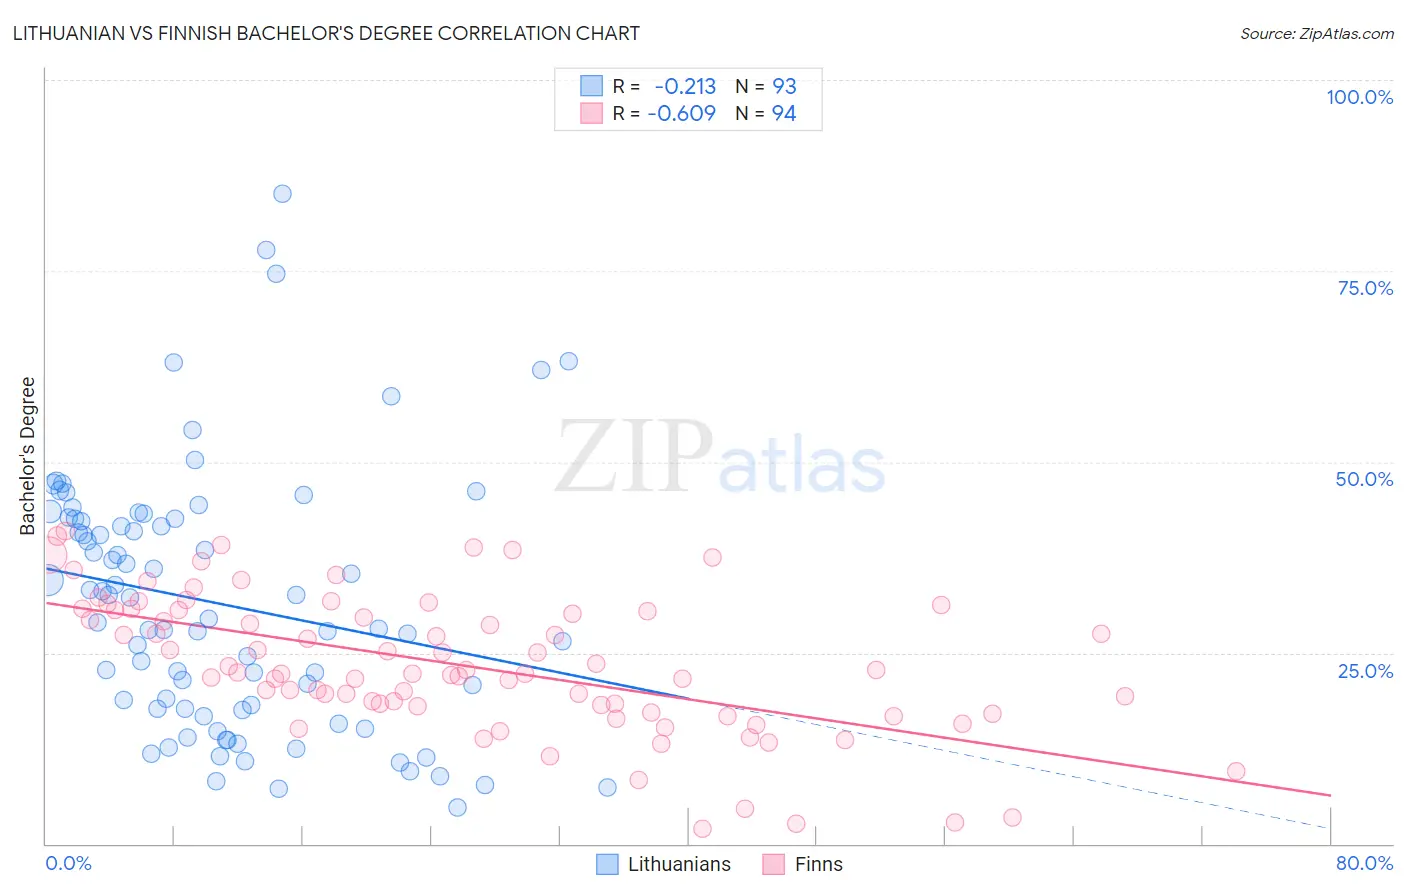
Lithuanian vs Finnish Bachelor's Degree Correlation Chart
The statistical analysis conducted on geographies consisting of 421,915,203 people shows a weak negative correlation between the proportion of Lithuanians and percentage of population with at least bachelor's degree education in the United States with a correlation coefficient (R) of -0.213 and weighted average of 42.2%. Similarly, the statistical analysis conducted on geographies consisting of 404,648,142 people shows a significant negative correlation between the proportion of Finns and percentage of population with at least bachelor's degree education in the United States with a correlation coefficient (R) of -0.609 and weighted average of 36.7%, a difference of 15.2%.
Bachelor's Degree Correlation Summary
| Measurement | Lithuanian | Finnish |
| Minimum | 4.7% | 2.0% |
| Maximum | 85.2% | 40.9% |
| Range | 80.5% | 38.9% |
| Mean | 31.4% | 23.4% |
| Median | 29.4% | 22.4% |
| Interquartile 25% (IQ1) | 17.6% | 18.0% |
| Interquartile 75% (IQ3) | 42.5% | 30.5% |
| Interquartile Range (IQR) | 25.0% | 12.6% |
| Standard Deviation (Sample) | 16.9% | 9.0% |
| Standard Deviation (Population) | 16.8% | 9.0% |
Similar Demographics by Bachelor's Degree
Demographics Similar to Lithuanians by Bachelor's Degree
In terms of bachelor's degree, the demographic groups most similar to Lithuanians are Immigrants from Western Asia (42.3%, a difference of 0.030%), Armenian (42.3%, a difference of 0.040%), Immigrants from Scotland (42.3%, a difference of 0.070%), Immigrants from Brazil (42.2%, a difference of 0.080%), and Immigrants from Hungary (42.3%, a difference of 0.14%).
| Demographics | Rating | Rank | Bachelor's Degree |
| Immigrants | Ethiopia | 99.4 /100 | #78 | Exceptional 42.5% |
| Immigrants | Lebanon | 99.3 /100 | #79 | Exceptional 42.4% |
| Immigrants | Croatia | 99.2 /100 | #80 | Exceptional 42.3% |
| Immigrants | Hungary | 99.2 /100 | #81 | Exceptional 42.3% |
| Immigrants | Scotland | 99.2 /100 | #82 | Exceptional 42.3% |
| Armenians | 99.2 /100 | #83 | Exceptional 42.3% |
| Immigrants | Western Asia | 99.2 /100 | #84 | Exceptional 42.3% |
| Lithuanians | 99.2 /100 | #85 | Exceptional 42.2% |
| Immigrants | Brazil | 99.2 /100 | #86 | Exceptional 42.2% |
| Carpatho Rusyns | 99.0 /100 | #87 | Exceptional 42.1% |
| Immigrants | Western Europe | 99.0 /100 | #88 | Exceptional 42.0% |
| Greeks | 99.0 /100 | #89 | Exceptional 42.0% |
| Laotians | 98.9 /100 | #90 | Exceptional 42.0% |
| Immigrants | Northern Africa | 98.9 /100 | #91 | Exceptional 41.9% |
| Maltese | 98.8 /100 | #92 | Exceptional 41.9% |
Demographics Similar to Finns by Bachelor's Degree
In terms of bachelor's degree, the demographic groups most similar to Finns are Immigrants (36.7%, a difference of 0.10%), Immigrants from Nigeria (36.7%, a difference of 0.14%), Spaniard (36.6%, a difference of 0.14%), Immigrants from Middle Africa (36.6%, a difference of 0.23%), and Immigrants from Zaire (36.8%, a difference of 0.43%).
| Demographics | Rating | Rank | Bachelor's Degree |
| Welsh | 29.1 /100 | #198 | Fair 37.0% |
| Immigrants | Costa Rica | 27.4 /100 | #199 | Fair 36.9% |
| Immigrants | Ghana | 27.4 /100 | #200 | Fair 36.9% |
| Immigrants | South Eastern Asia | 25.4 /100 | #201 | Fair 36.8% |
| Immigrants | Zaire | 25.3 /100 | #202 | Fair 36.8% |
| Immigrants | Nigeria | 23.1 /100 | #203 | Fair 36.7% |
| Immigrants | Immigrants | 22.8 /100 | #204 | Fair 36.7% |
| Finns | 22.2 /100 | #205 | Fair 36.7% |
| Spaniards | 21.2 /100 | #206 | Fair 36.6% |
| Immigrants | Middle Africa | 20.6 /100 | #207 | Fair 36.6% |
| Immigrants | Thailand | 19.4 /100 | #208 | Poor 36.5% |
| Panamanians | 18.8 /100 | #209 | Poor 36.5% |
| French | 18.6 /100 | #210 | Poor 36.5% |
| Scotch-Irish | 18.3 /100 | #211 | Poor 36.4% |
| Immigrants | Philippines | 17.8 /100 | #212 | Poor 36.4% |