Senegalese vs British Associate's Degree
COMPARE
Senegalese
British
Associate's Degree
Associate's Degree Comparison
Senegalese
British
45.2%
ASSOCIATE'S DEGREE
21.1/ 100
METRIC RATING
200th/ 347
METRIC RANK
48.9%
ASSOCIATE'S DEGREE
95.0/ 100
METRIC RATING
116th/ 347
METRIC RANK
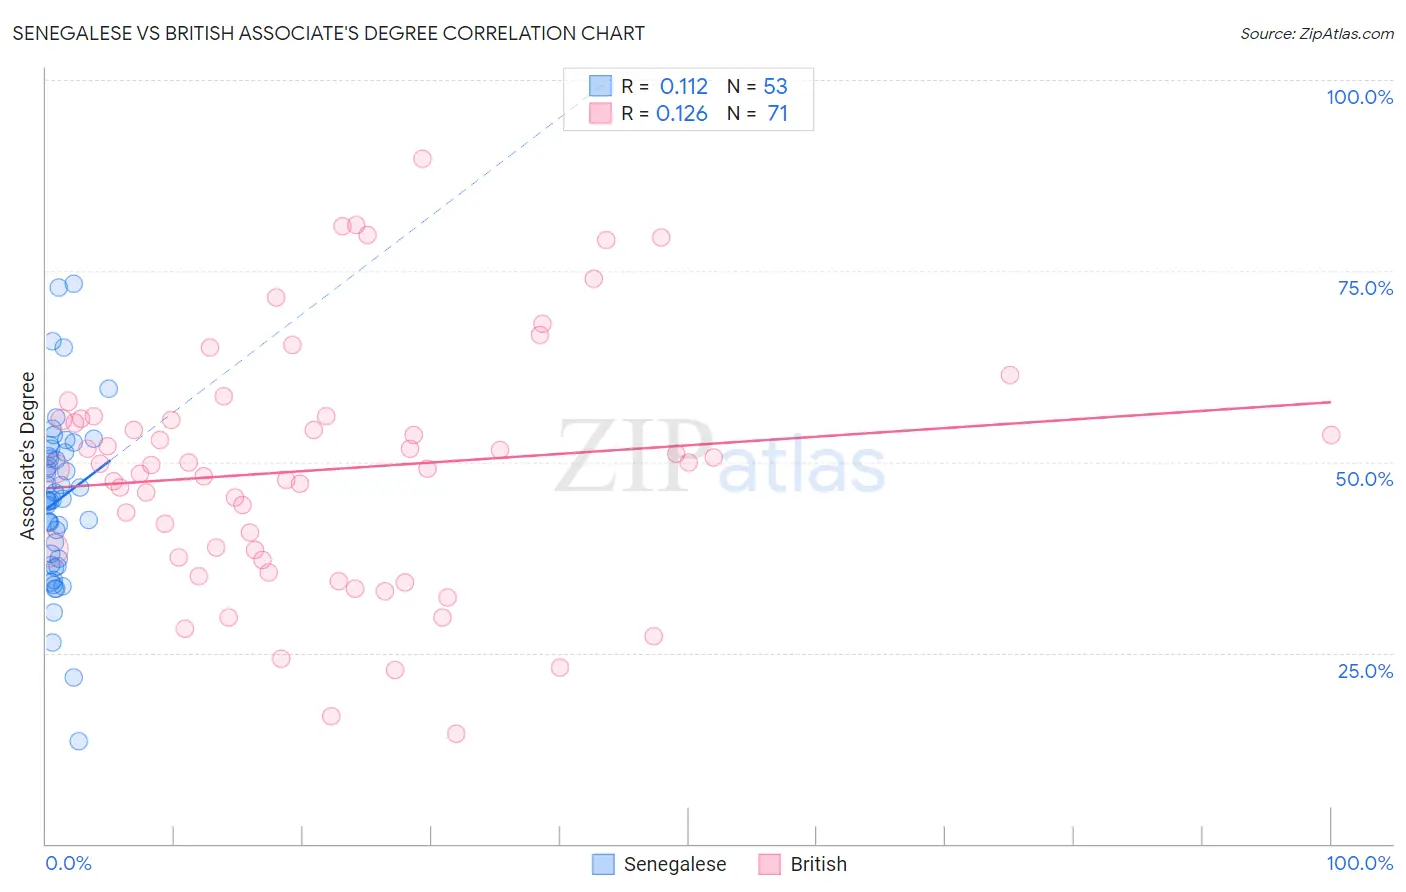
Senegalese vs British Associate's Degree Correlation Chart
The statistical analysis conducted on geographies consisting of 78,136,633 people shows a poor positive correlation between the proportion of Senegalese and percentage of population with at least associate's degree education in the United States with a correlation coefficient (R) of 0.112 and weighted average of 45.2%. Similarly, the statistical analysis conducted on geographies consisting of 531,402,348 people shows a poor positive correlation between the proportion of British and percentage of population with at least associate's degree education in the United States with a correlation coefficient (R) of 0.126 and weighted average of 48.9%, a difference of 8.2%.
Associate's Degree Correlation Summary
| Measurement | Senegalese | British |
| Minimum | 13.4% | 14.3% |
| Maximum | 73.4% | 89.7% |
| Range | 60.0% | 75.3% |
| Mean | 45.0% | 49.0% |
| Median | 44.9% | 49.7% |
| Interquartile 25% (IQ1) | 36.9% | 37.4% |
| Interquartile 75% (IQ3) | 51.4% | 55.7% |
| Interquartile Range (IQR) | 14.5% | 18.3% |
| Standard Deviation (Sample) | 11.3% | 15.9% |
| Standard Deviation (Population) | 11.2% | 15.8% |
Similar Demographics by Associate's Degree
Demographics Similar to Senegalese by Associate's Degree
In terms of associate's degree, the demographic groups most similar to Senegalese are Immigrants from Senegal (45.2%, a difference of 0.010%), Immigrants from Bangladesh (45.2%, a difference of 0.030%), Immigrants from Vietnam (45.2%, a difference of 0.030%), Spaniard (45.2%, a difference of 0.080%), and Immigrants from South Eastern Asia (45.2%, a difference of 0.10%).
| Demographics | Rating | Rank | Associate's Degree |
| Immigrants | Cameroon | 31.0 /100 | #193 | Fair 45.7% |
| Immigrants | Peru | 27.6 /100 | #194 | Fair 45.5% |
| Germans | 26.5 /100 | #195 | Fair 45.5% |
| French | 25.6 /100 | #196 | Fair 45.4% |
| Scotch-Irish | 22.3 /100 | #197 | Fair 45.3% |
| Immigrants | Bangladesh | 21.3 /100 | #198 | Fair 45.2% |
| Immigrants | Senegal | 21.2 /100 | #199 | Fair 45.2% |
| Senegalese | 21.1 /100 | #200 | Fair 45.2% |
| Immigrants | Vietnam | 20.8 /100 | #201 | Fair 45.2% |
| Spaniards | 20.4 /100 | #202 | Fair 45.2% |
| Immigrants | South Eastern Asia | 20.2 /100 | #203 | Fair 45.2% |
| Nigerians | 19.1 /100 | #204 | Poor 45.1% |
| Immigrants | Thailand | 18.9 /100 | #205 | Poor 45.1% |
| German Russians | 18.9 /100 | #206 | Poor 45.1% |
| Panamanians | 18.4 /100 | #207 | Poor 45.1% |
Demographics Similar to British by Associate's Degree
In terms of associate's degree, the demographic groups most similar to British are Afghan (48.9%, a difference of 0.040%), Luxembourger (48.9%, a difference of 0.070%), Albanian (48.8%, a difference of 0.11%), Lebanese (48.8%, a difference of 0.12%), and Palestinian (49.0%, a difference of 0.13%).
| Demographics | Rating | Rank | Associate's Degree |
| Immigrants | Morocco | 96.3 /100 | #109 | Exceptional 49.2% |
| Austrians | 95.8 /100 | #110 | Exceptional 49.1% |
| Immigrants | Venezuela | 95.8 /100 | #111 | Exceptional 49.1% |
| Immigrants | Chile | 95.3 /100 | #112 | Exceptional 49.0% |
| Palestinians | 95.3 /100 | #113 | Exceptional 49.0% |
| Arabs | 95.3 /100 | #114 | Exceptional 49.0% |
| Luxembourgers | 95.1 /100 | #115 | Exceptional 48.9% |
| British | 95.0 /100 | #116 | Exceptional 48.9% |
| Afghans | 94.8 /100 | #117 | Exceptional 48.9% |
| Albanians | 94.7 /100 | #118 | Exceptional 48.8% |
| Lebanese | 94.6 /100 | #119 | Exceptional 48.8% |
| Alsatians | 94.6 /100 | #120 | Exceptional 48.8% |
| Ugandans | 93.9 /100 | #121 | Exceptional 48.7% |
| Italians | 93.9 /100 | #122 | Exceptional 48.7% |
| Brazilians | 93.7 /100 | #123 | Exceptional 48.7% |