Korean vs Immigrants from Bangladesh Nursery School
COMPARE
Korean
Immigrants from Bangladesh
Nursery School
Nursery School Comparison
Koreans
Immigrants from Bangladesh
97.7%
NURSERY SCHOOL
1.4/ 100
METRIC RATING
240th/ 347
METRIC RANK
96.9%
NURSERY SCHOOL
0.0/ 100
METRIC RATING
321st/ 347
METRIC RANK
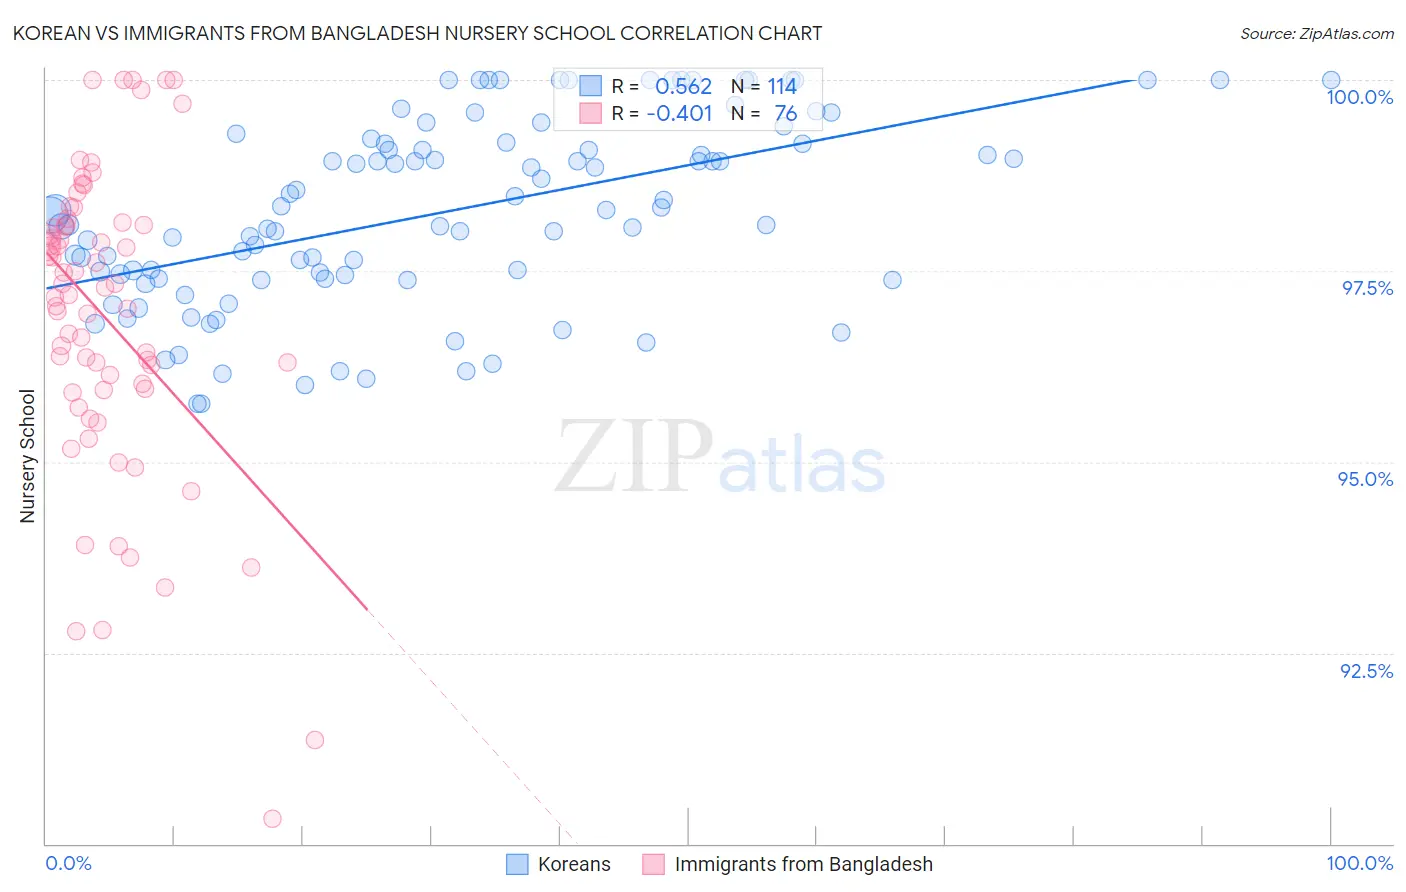
Korean vs Immigrants from Bangladesh Nursery School Correlation Chart
The statistical analysis conducted on geographies consisting of 510,935,951 people shows a substantial positive correlation between the proportion of Koreans and percentage of population with at least nursery school education in the United States with a correlation coefficient (R) of 0.562 and weighted average of 97.7%. Similarly, the statistical analysis conducted on geographies consisting of 203,681,254 people shows a moderate negative correlation between the proportion of Immigrants from Bangladesh and percentage of population with at least nursery school education in the United States with a correlation coefficient (R) of -0.401 and weighted average of 96.9%, a difference of 0.82%.
Nursery School Correlation Summary
| Measurement | Korean | Immigrants from Bangladesh |
| Minimum | 95.8% | 90.3% |
| Maximum | 100.0% | 100.0% |
| Range | 4.2% | 9.7% |
| Mean | 98.3% | 96.9% |
| Median | 98.3% | 97.2% |
| Interquartile 25% (IQ1) | 97.4% | 96.0% |
| Interquartile 75% (IQ3) | 99.2% | 98.1% |
| Interquartile Range (IQR) | 1.8% | 2.1% |
| Standard Deviation (Sample) | 1.2% | 2.0% |
| Standard Deviation (Population) | 1.2% | 2.0% |
Similar Demographics by Nursery School
Demographics Similar to Koreans by Nursery School
In terms of nursery school, the demographic groups most similar to Koreans are Nigerian (97.7%, a difference of 0.010%), Immigrants from Eastern Asia (97.7%, a difference of 0.010%), Immigrants from Malaysia (97.7%, a difference of 0.020%), Immigrants from Western Asia (97.7%, a difference of 0.020%), and Immigrants from Indonesia (97.7%, a difference of 0.020%).
| Demographics | Rating | Rank | Nursery School |
| U.S. Virgin Islanders | 2.1 /100 | #233 | Tragic 97.7% |
| Colombians | 2.1 /100 | #234 | Tragic 97.7% |
| Immigrants | Pakistan | 2.1 /100 | #235 | Tragic 97.7% |
| Immigrants | Malaysia | 1.9 /100 | #236 | Tragic 97.7% |
| Immigrants | Western Asia | 1.9 /100 | #237 | Tragic 97.7% |
| Nigerians | 1.7 /100 | #238 | Tragic 97.7% |
| Immigrants | Eastern Asia | 1.6 /100 | #239 | Tragic 97.7% |
| Koreans | 1.4 /100 | #240 | Tragic 97.7% |
| Immigrants | Indonesia | 1.1 /100 | #241 | Tragic 97.7% |
| Liberians | 1.1 /100 | #242 | Tragic 97.7% |
| Asians | 1.1 /100 | #243 | Tragic 97.6% |
| South Americans | 1.0 /100 | #244 | Tragic 97.6% |
| Bolivians | 1.0 /100 | #245 | Tragic 97.6% |
| Peruvians | 1.0 /100 | #246 | Tragic 97.6% |
| Immigrants | Middle Africa | 0.9 /100 | #247 | Tragic 97.6% |
Demographics Similar to Immigrants from Bangladesh by Nursery School
In terms of nursery school, the demographic groups most similar to Immigrants from Bangladesh are Immigrants from Burma/Myanmar (96.9%, a difference of 0.0%), Immigrants from Laos (96.9%, a difference of 0.010%), Immigrants from Guyana (96.9%, a difference of 0.020%), Mexican American Indian (96.9%, a difference of 0.020%), and Immigrants from Honduras (96.9%, a difference of 0.020%).
| Demographics | Rating | Rank | Nursery School |
| Cape Verdeans | 0.0 /100 | #314 | Tragic 97.0% |
| Immigrants | Nicaragua | 0.0 /100 | #315 | Tragic 96.9% |
| Immigrants | Belize | 0.0 /100 | #316 | Tragic 96.9% |
| Immigrants | Ecuador | 0.0 /100 | #317 | Tragic 96.9% |
| Immigrants | Guyana | 0.0 /100 | #318 | Tragic 96.9% |
| Immigrants | Laos | 0.0 /100 | #319 | Tragic 96.9% |
| Immigrants | Burma/Myanmar | 0.0 /100 | #320 | Tragic 96.9% |
| Immigrants | Bangladesh | 0.0 /100 | #321 | Tragic 96.9% |
| Mexican American Indians | 0.0 /100 | #322 | Tragic 96.9% |
| Immigrants | Honduras | 0.0 /100 | #323 | Tragic 96.9% |
| Vietnamese | 0.0 /100 | #324 | Tragic 96.8% |
| Dominicans | 0.0 /100 | #325 | Tragic 96.8% |
| Indonesians | 0.0 /100 | #326 | Tragic 96.8% |
| Mexicans | 0.0 /100 | #327 | Tragic 96.8% |
| Immigrants | Latin America | 0.0 /100 | #328 | Tragic 96.7% |