Korean vs Immigrants from Switzerland Nursery School
COMPARE
Korean
Immigrants from Switzerland
Nursery School
Nursery School Comparison
Koreans
Immigrants from Switzerland
97.7%
NURSERY SCHOOL
1.4/ 100
METRIC RATING
240th/ 347
METRIC RANK
98.2%
NURSERY SCHOOL
97.3/ 100
METRIC RATING
106th/ 347
METRIC RANK
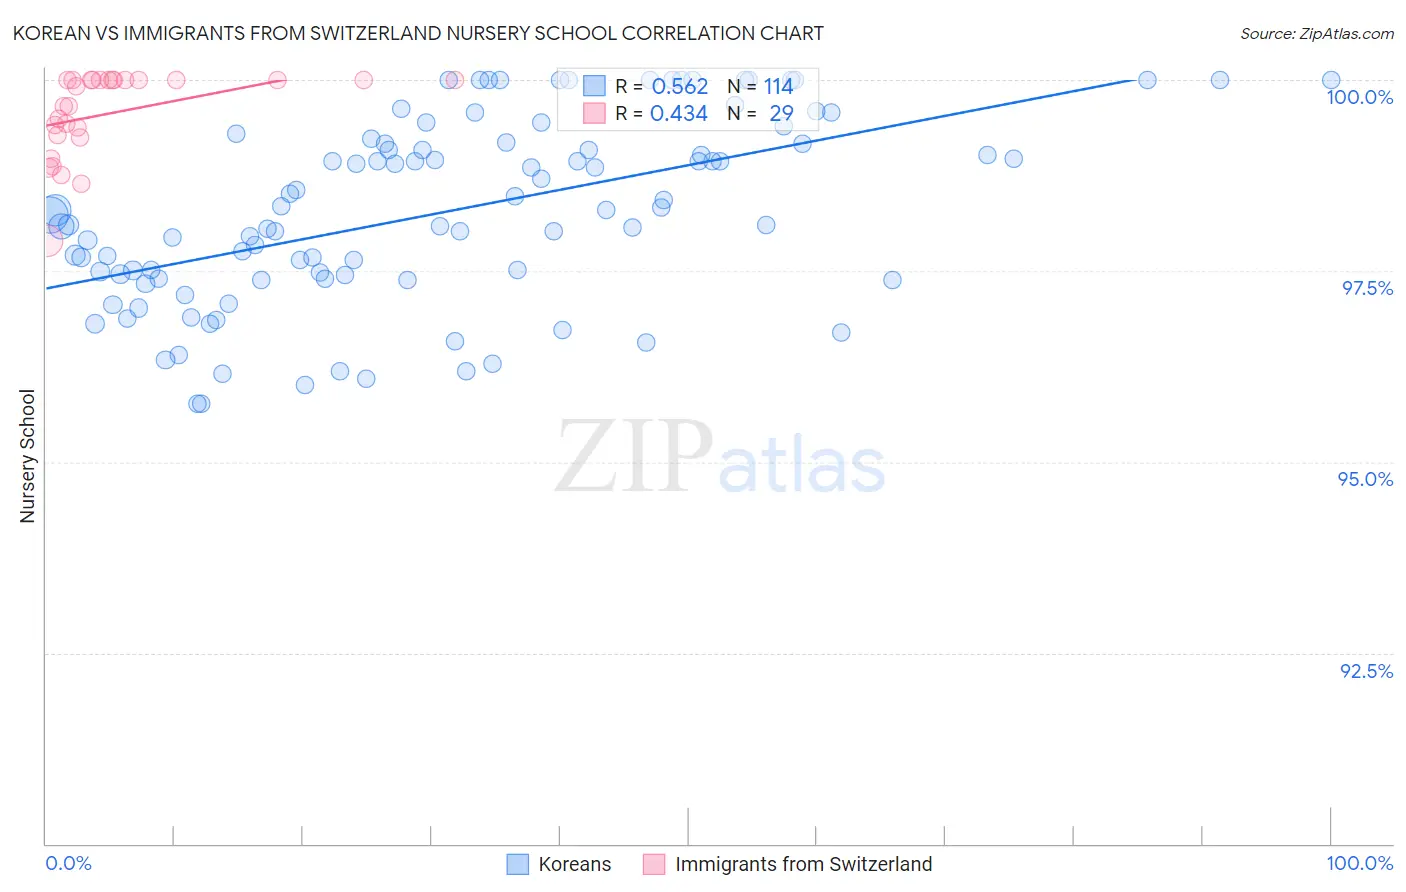
Korean vs Immigrants from Switzerland Nursery School Correlation Chart
The statistical analysis conducted on geographies consisting of 510,935,951 people shows a substantial positive correlation between the proportion of Koreans and percentage of population with at least nursery school education in the United States with a correlation coefficient (R) of 0.562 and weighted average of 97.7%. Similarly, the statistical analysis conducted on geographies consisting of 148,082,451 people shows a moderate positive correlation between the proportion of Immigrants from Switzerland and percentage of population with at least nursery school education in the United States with a correlation coefficient (R) of 0.434 and weighted average of 98.2%, a difference of 0.59%.
Nursery School Correlation Summary
| Measurement | Korean | Immigrants from Switzerland |
| Minimum | 95.8% | 97.9% |
| Maximum | 100.0% | 100.0% |
| Range | 4.2% | 2.1% |
| Mean | 98.3% | 99.6% |
| Median | 98.3% | 99.9% |
| Interquartile 25% (IQ1) | 97.4% | 99.3% |
| Interquartile 75% (IQ3) | 99.2% | 100.0% |
| Interquartile Range (IQR) | 1.8% | 0.74% |
| Standard Deviation (Sample) | 1.2% | 0.56% |
| Standard Deviation (Population) | 1.2% | 0.55% |
Similar Demographics by Nursery School
Demographics Similar to Koreans by Nursery School
In terms of nursery school, the demographic groups most similar to Koreans are Nigerian (97.7%, a difference of 0.010%), Immigrants from Eastern Asia (97.7%, a difference of 0.010%), Immigrants from Malaysia (97.7%, a difference of 0.020%), Immigrants from Western Asia (97.7%, a difference of 0.020%), and Immigrants from Indonesia (97.7%, a difference of 0.020%).
| Demographics | Rating | Rank | Nursery School |
| U.S. Virgin Islanders | 2.1 /100 | #233 | Tragic 97.7% |
| Colombians | 2.1 /100 | #234 | Tragic 97.7% |
| Immigrants | Pakistan | 2.1 /100 | #235 | Tragic 97.7% |
| Immigrants | Malaysia | 1.9 /100 | #236 | Tragic 97.7% |
| Immigrants | Western Asia | 1.9 /100 | #237 | Tragic 97.7% |
| Nigerians | 1.7 /100 | #238 | Tragic 97.7% |
| Immigrants | Eastern Asia | 1.6 /100 | #239 | Tragic 97.7% |
| Koreans | 1.4 /100 | #240 | Tragic 97.7% |
| Immigrants | Indonesia | 1.1 /100 | #241 | Tragic 97.7% |
| Liberians | 1.1 /100 | #242 | Tragic 97.7% |
| Asians | 1.1 /100 | #243 | Tragic 97.6% |
| South Americans | 1.0 /100 | #244 | Tragic 97.6% |
| Bolivians | 1.0 /100 | #245 | Tragic 97.6% |
| Peruvians | 1.0 /100 | #246 | Tragic 97.6% |
| Immigrants | Middle Africa | 0.9 /100 | #247 | Tragic 97.6% |
Demographics Similar to Immigrants from Switzerland by Nursery School
In terms of nursery school, the demographic groups most similar to Immigrants from Switzerland are Bhutanese (98.2%, a difference of 0.0%), Turkish (98.2%, a difference of 0.0%), Basque (98.2%, a difference of 0.0%), Immigrants from Ireland (98.3%, a difference of 0.010%), and Cree (98.3%, a difference of 0.010%).
| Demographics | Rating | Rank | Nursery School |
| Colville | 98.2 /100 | #99 | Exceptional 98.3% |
| Puget Sound Salish | 98.0 /100 | #100 | Exceptional 98.3% |
| Romanians | 97.9 /100 | #101 | Exceptional 98.3% |
| Immigrants | Ireland | 97.7 /100 | #102 | Exceptional 98.3% |
| Cree | 97.7 /100 | #103 | Exceptional 98.3% |
| Bhutanese | 97.4 /100 | #104 | Exceptional 98.2% |
| Turks | 97.4 /100 | #105 | Exceptional 98.2% |
| Immigrants | Switzerland | 97.3 /100 | #106 | Exceptional 98.2% |
| Basques | 97.3 /100 | #107 | Exceptional 98.2% |
| Pima | 97.1 /100 | #108 | Exceptional 98.2% |
| German Russians | 97.1 /100 | #109 | Exceptional 98.2% |
| Immigrants | Singapore | 96.9 /100 | #110 | Exceptional 98.2% |
| Immigrants | Czechoslovakia | 96.8 /100 | #111 | Exceptional 98.2% |
| Immigrants | Norway | 96.6 /100 | #112 | Exceptional 98.2% |
| Immigrants | Latvia | 96.4 /100 | #113 | Exceptional 98.2% |