Korean vs Armenian Nursery School
COMPARE
Korean
Armenian
Nursery School
Nursery School Comparison
Koreans
Armenians
97.7%
NURSERY SCHOOL
1.4/ 100
METRIC RATING
240th/ 347
METRIC RANK
97.6%
NURSERY SCHOOL
0.4/ 100
METRIC RATING
259th/ 347
METRIC RANK
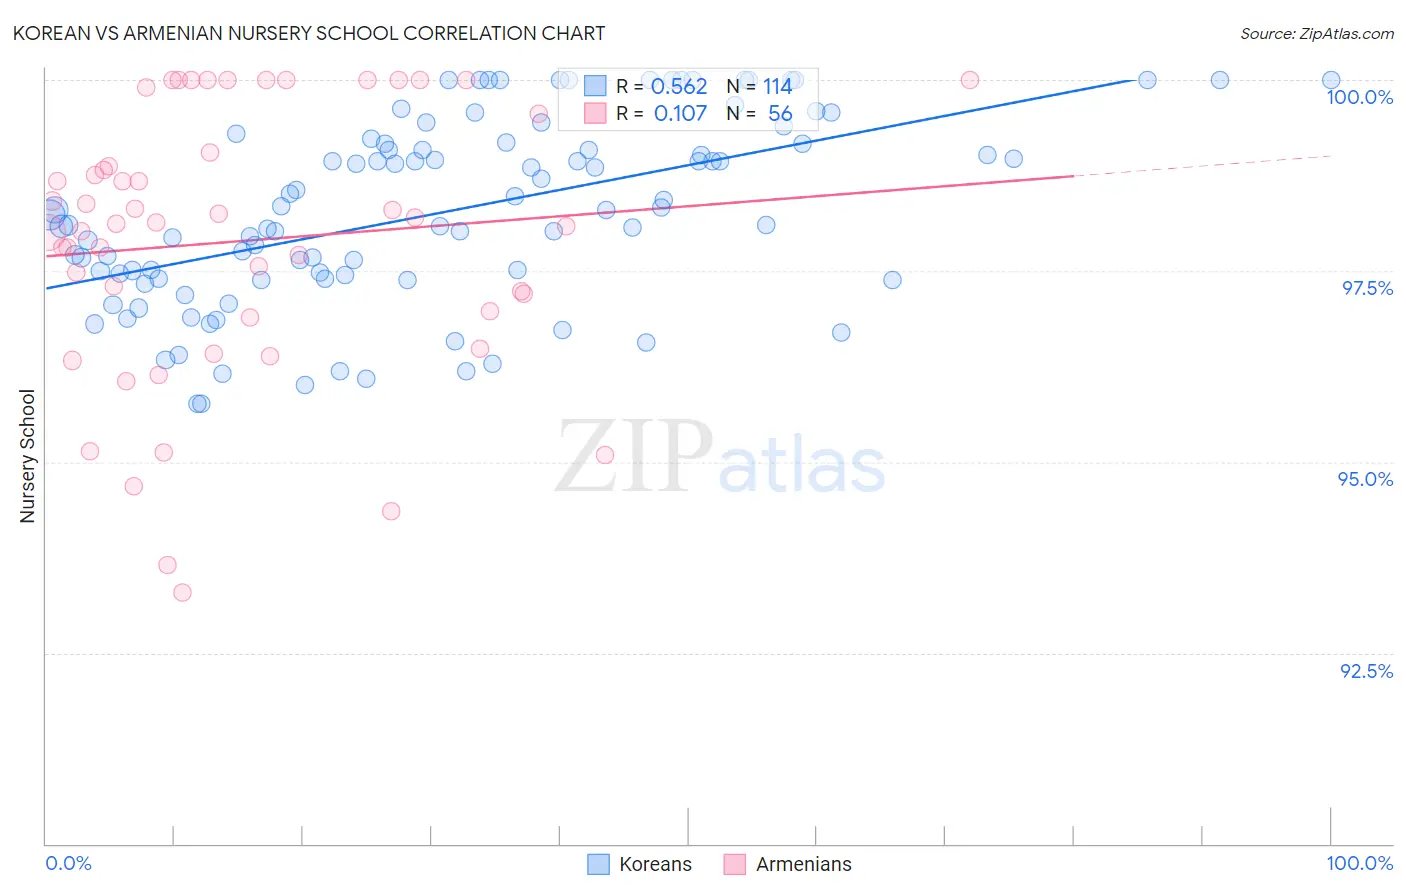
Korean vs Armenian Nursery School Correlation Chart
The statistical analysis conducted on geographies consisting of 510,935,951 people shows a substantial positive correlation between the proportion of Koreans and percentage of population with at least nursery school education in the United States with a correlation coefficient (R) of 0.562 and weighted average of 97.7%. Similarly, the statistical analysis conducted on geographies consisting of 310,954,660 people shows a poor positive correlation between the proportion of Armenians and percentage of population with at least nursery school education in the United States with a correlation coefficient (R) of 0.107 and weighted average of 97.6%, a difference of 0.090%.
Nursery School Correlation Summary
| Measurement | Korean | Armenian |
| Minimum | 95.8% | 93.3% |
| Maximum | 100.0% | 100.0% |
| Range | 4.2% | 6.7% |
| Mean | 98.3% | 97.9% |
| Median | 98.3% | 98.1% |
| Interquartile 25% (IQ1) | 97.4% | 96.9% |
| Interquartile 75% (IQ3) | 99.2% | 99.3% |
| Interquartile Range (IQR) | 1.8% | 2.4% |
| Standard Deviation (Sample) | 1.2% | 1.8% |
| Standard Deviation (Population) | 1.2% | 1.7% |
Demographics Similar to Koreans and Armenians by Nursery School
In terms of nursery school, the demographic groups most similar to Koreans are Immigrants from Eastern Asia (97.7%, a difference of 0.010%), Immigrants from Indonesia (97.7%, a difference of 0.020%), Liberian (97.7%, a difference of 0.020%), Asian (97.6%, a difference of 0.020%), and South American (97.6%, a difference of 0.030%). Similarly, the demographic groups most similar to Armenians are Jamaican (97.6%, a difference of 0.020%), Immigrants from Asia (97.6%, a difference of 0.030%), Yaqui (97.6%, a difference of 0.030%), Immigrants from Colombia (97.6%, a difference of 0.030%), and Immigrants from Africa (97.6%, a difference of 0.040%).
| Demographics | Rating | Rank | Nursery School |
| Immigrants | Eastern Asia | 1.6 /100 | #239 | Tragic 97.7% |
| Koreans | 1.4 /100 | #240 | Tragic 97.7% |
| Immigrants | Indonesia | 1.1 /100 | #241 | Tragic 97.7% |
| Liberians | 1.1 /100 | #242 | Tragic 97.7% |
| Asians | 1.1 /100 | #243 | Tragic 97.6% |
| South Americans | 1.0 /100 | #244 | Tragic 97.6% |
| Bolivians | 1.0 /100 | #245 | Tragic 97.6% |
| Peruvians | 1.0 /100 | #246 | Tragic 97.6% |
| Immigrants | Middle Africa | 0.9 /100 | #247 | Tragic 97.6% |
| Indians (Asian) | 0.9 /100 | #248 | Tragic 97.6% |
| Immigrants | Eastern Africa | 0.9 /100 | #249 | Tragic 97.6% |
| Immigrants | Senegal | 0.9 /100 | #250 | Tragic 97.6% |
| Ethiopians | 0.8 /100 | #251 | Tragic 97.6% |
| Immigrants | Africa | 0.8 /100 | #252 | Tragic 97.6% |
| Immigrants | Iraq | 0.7 /100 | #253 | Tragic 97.6% |
| Immigrants | Congo | 0.7 /100 | #254 | Tragic 97.6% |
| Immigrants | Asia | 0.7 /100 | #255 | Tragic 97.6% |
| Yaqui | 0.6 /100 | #256 | Tragic 97.6% |
| Immigrants | Colombia | 0.6 /100 | #257 | Tragic 97.6% |
| Jamaicans | 0.6 /100 | #258 | Tragic 97.6% |
| Armenians | 0.4 /100 | #259 | Tragic 97.6% |