Immigrants from Syria vs Immigrants from Bangladesh Nursery School
COMPARE
Immigrants from Syria
Immigrants from Bangladesh
Nursery School
Nursery School Comparison
Immigrants from Syria
Immigrants from Bangladesh
97.7%
NURSERY SCHOOL
4.0/ 100
METRIC RATING
222nd/ 347
METRIC RANK
96.9%
NURSERY SCHOOL
0.0/ 100
METRIC RATING
321st/ 347
METRIC RANK
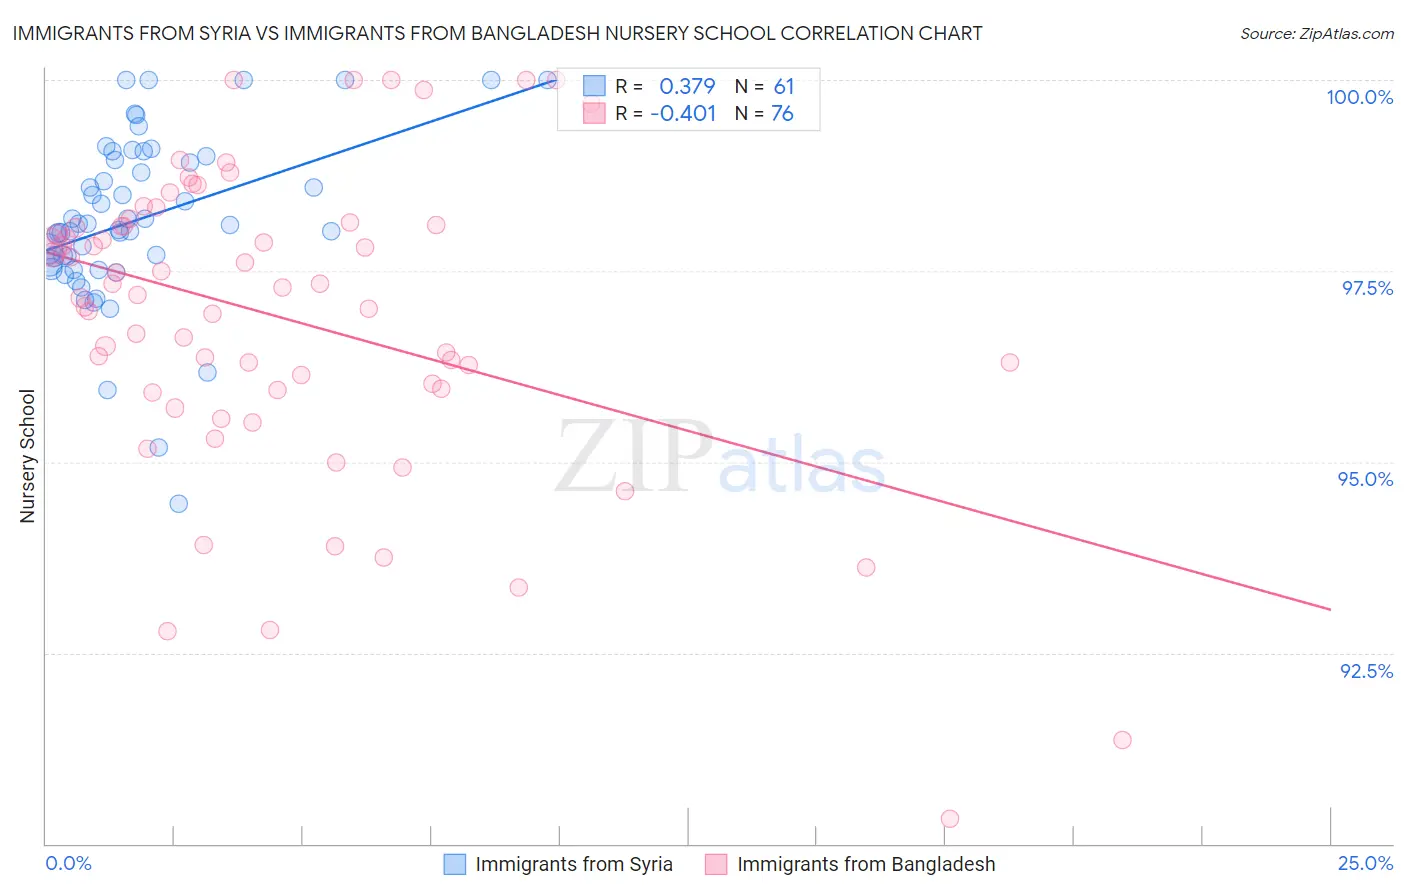
Immigrants from Syria vs Immigrants from Bangladesh Nursery School Correlation Chart
The statistical analysis conducted on geographies consisting of 174,108,882 people shows a mild positive correlation between the proportion of Immigrants from Syria and percentage of population with at least nursery school education in the United States with a correlation coefficient (R) of 0.379 and weighted average of 97.7%. Similarly, the statistical analysis conducted on geographies consisting of 203,681,254 people shows a moderate negative correlation between the proportion of Immigrants from Bangladesh and percentage of population with at least nursery school education in the United States with a correlation coefficient (R) of -0.401 and weighted average of 96.9%, a difference of 0.90%.
Nursery School Correlation Summary
| Measurement | Immigrants from Syria | Immigrants from Bangladesh |
| Minimum | 94.4% | 90.3% |
| Maximum | 100.0% | 100.0% |
| Range | 5.6% | 9.7% |
| Mean | 98.2% | 96.9% |
| Median | 98.1% | 97.2% |
| Interquartile 25% (IQ1) | 97.6% | 96.0% |
| Interquartile 75% (IQ3) | 99.0% | 98.1% |
| Interquartile Range (IQR) | 1.4% | 2.1% |
| Standard Deviation (Sample) | 1.1% | 2.0% |
| Standard Deviation (Population) | 1.1% | 2.0% |
Similar Demographics by Nursery School
Demographics Similar to Immigrants from Syria by Nursery School
In terms of nursery school, the demographic groups most similar to Immigrants from Syria are Immigrants from Sudan (97.7%, a difference of 0.0%), Immigrants from Zaire (97.8%, a difference of 0.010%), Tongan (97.8%, a difference of 0.010%), Immigrants from Nepal (97.7%, a difference of 0.010%), and Immigrants from Costa Rica (97.7%, a difference of 0.010%).
| Demographics | Rating | Rank | Nursery School |
| Bahamians | 7.4 /100 | #215 | Tragic 97.8% |
| Uruguayans | 7.1 /100 | #216 | Tragic 97.8% |
| Samoans | 6.3 /100 | #217 | Tragic 97.8% |
| Immigrants | Panama | 5.3 /100 | #218 | Tragic 97.8% |
| Immigrants | Morocco | 5.1 /100 | #219 | Tragic 97.8% |
| Immigrants | Zaire | 4.4 /100 | #220 | Tragic 97.8% |
| Tongans | 4.3 /100 | #221 | Tragic 97.8% |
| Immigrants | Syria | 4.0 /100 | #222 | Tragic 97.7% |
| Immigrants | Sudan | 3.9 /100 | #223 | Tragic 97.7% |
| Immigrants | Nepal | 3.6 /100 | #224 | Tragic 97.7% |
| Immigrants | Costa Rica | 3.5 /100 | #225 | Tragic 97.7% |
| Iraqis | 3.5 /100 | #226 | Tragic 97.7% |
| Sub-Saharan Africans | 3.2 /100 | #227 | Tragic 97.7% |
| Sudanese | 3.2 /100 | #228 | Tragic 97.7% |
| Senegalese | 3.2 /100 | #229 | Tragic 97.7% |
Demographics Similar to Immigrants from Bangladesh by Nursery School
In terms of nursery school, the demographic groups most similar to Immigrants from Bangladesh are Immigrants from Burma/Myanmar (96.9%, a difference of 0.0%), Immigrants from Laos (96.9%, a difference of 0.010%), Immigrants from Guyana (96.9%, a difference of 0.020%), Mexican American Indian (96.9%, a difference of 0.020%), and Immigrants from Honduras (96.9%, a difference of 0.020%).
| Demographics | Rating | Rank | Nursery School |
| Cape Verdeans | 0.0 /100 | #314 | Tragic 97.0% |
| Immigrants | Nicaragua | 0.0 /100 | #315 | Tragic 96.9% |
| Immigrants | Belize | 0.0 /100 | #316 | Tragic 96.9% |
| Immigrants | Ecuador | 0.0 /100 | #317 | Tragic 96.9% |
| Immigrants | Guyana | 0.0 /100 | #318 | Tragic 96.9% |
| Immigrants | Laos | 0.0 /100 | #319 | Tragic 96.9% |
| Immigrants | Burma/Myanmar | 0.0 /100 | #320 | Tragic 96.9% |
| Immigrants | Bangladesh | 0.0 /100 | #321 | Tragic 96.9% |
| Mexican American Indians | 0.0 /100 | #322 | Tragic 96.9% |
| Immigrants | Honduras | 0.0 /100 | #323 | Tragic 96.9% |
| Vietnamese | 0.0 /100 | #324 | Tragic 96.8% |
| Dominicans | 0.0 /100 | #325 | Tragic 96.8% |
| Indonesians | 0.0 /100 | #326 | Tragic 96.8% |
| Mexicans | 0.0 /100 | #327 | Tragic 96.8% |
| Immigrants | Latin America | 0.0 /100 | #328 | Tragic 96.7% |