Kiowa vs British College, Under 1 year
COMPARE
Kiowa
British
College, Under 1 year
College, Under 1 year Comparison
Kiowa
British
57.8%
COLLEGE, UNDER 1 YEAR
0.0/ 100
METRIC RATING
304th/ 347
METRIC RANK
68.5%
COLLEGE, UNDER 1 YEAR
98.6/ 100
METRIC RATING
77th/ 347
METRIC RANK
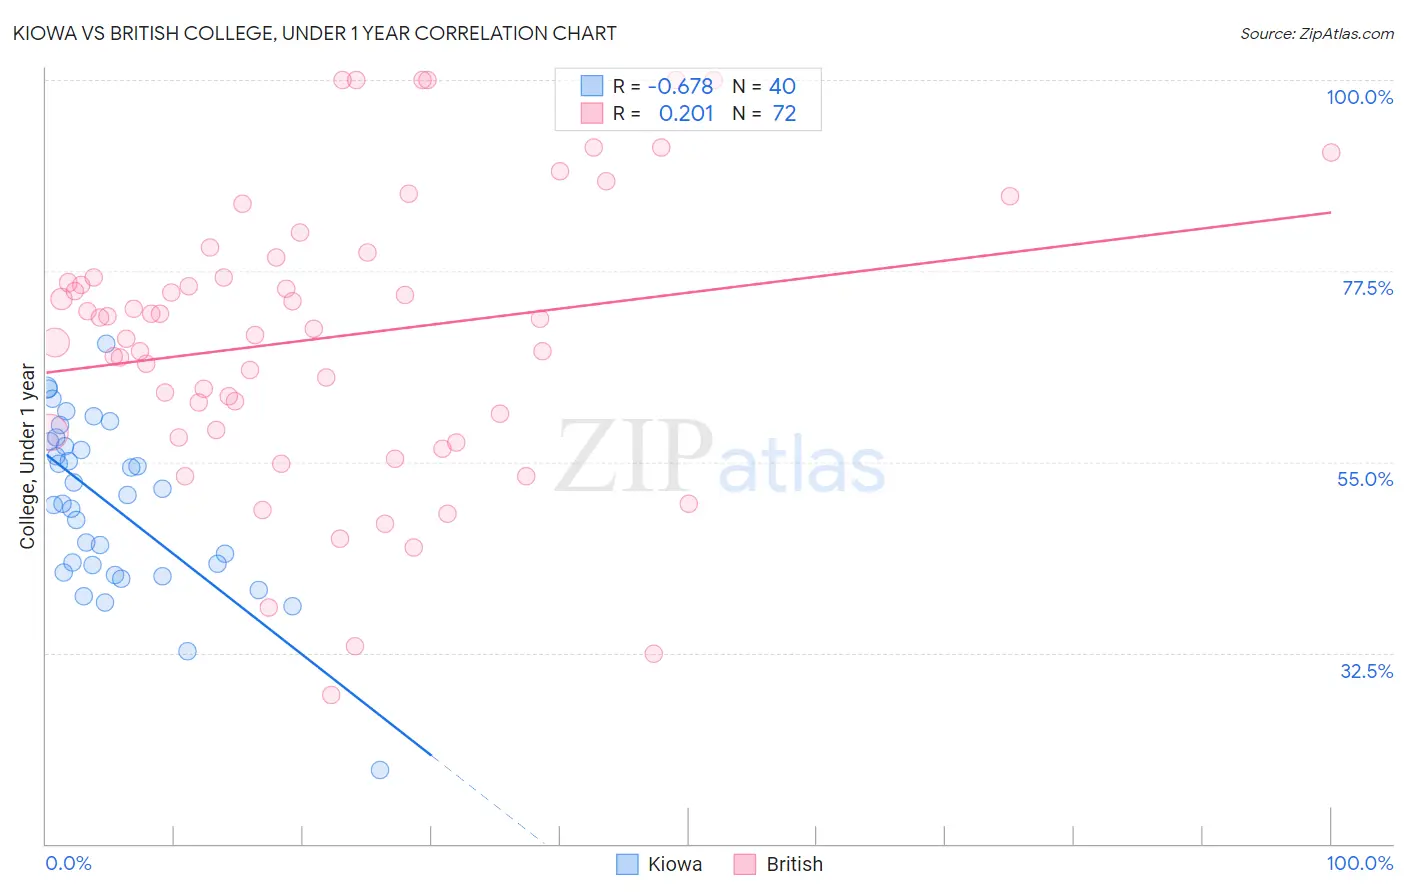
Kiowa vs British College, Under 1 year Correlation Chart
The statistical analysis conducted on geographies consisting of 56,101,444 people shows a significant negative correlation between the proportion of Kiowa and percentage of population with at least college, under 1 year education in the United States with a correlation coefficient (R) of -0.678 and weighted average of 57.8%. Similarly, the statistical analysis conducted on geographies consisting of 531,460,716 people shows a weak positive correlation between the proportion of British and percentage of population with at least college, under 1 year education in the United States with a correlation coefficient (R) of 0.201 and weighted average of 68.5%, a difference of 18.4%.
College, Under 1 year Correlation Summary
| Measurement | Kiowa | British |
| Minimum | 18.8% | 27.5% |
| Maximum | 68.9% | 100.0% |
| Range | 50.2% | 72.5% |
| Mean | 49.8% | 69.6% |
| Median | 50.6% | 71.2% |
| Interquartile 25% (IQ1) | 42.4% | 58.6% |
| Interquartile 75% (IQ3) | 57.2% | 77.9% |
| Interquartile Range (IQR) | 14.8% | 19.3% |
| Standard Deviation (Sample) | 10.0% | 16.7% |
| Standard Deviation (Population) | 9.9% | 16.6% |
Similar Demographics by College, Under 1 year
Demographics Similar to Kiowa by College, Under 1 year
In terms of college, under 1 year, the demographic groups most similar to Kiowa are Immigrants from Dominica (57.9%, a difference of 0.010%), Haitian (57.8%, a difference of 0.11%), Apache (58.0%, a difference of 0.30%), Immigrants from Portugal (57.7%, a difference of 0.31%), and Fijian (57.7%, a difference of 0.32%).
| Demographics | Rating | Rank | College, Under 1 year |
| Guyanese | 0.0 /100 | #297 | Tragic 59.0% |
| Immigrants | Ecuador | 0.0 /100 | #298 | Tragic 58.7% |
| Cubans | 0.0 /100 | #299 | Tragic 58.6% |
| Immigrants | Guyana | 0.0 /100 | #300 | Tragic 58.5% |
| Mexican American Indians | 0.0 /100 | #301 | Tragic 58.1% |
| Apache | 0.0 /100 | #302 | Tragic 58.0% |
| Immigrants | Dominica | 0.0 /100 | #303 | Tragic 57.9% |
| Kiowa | 0.0 /100 | #304 | Tragic 57.8% |
| Haitians | 0.0 /100 | #305 | Tragic 57.8% |
| Immigrants | Portugal | 0.0 /100 | #306 | Tragic 57.7% |
| Fijians | 0.0 /100 | #307 | Tragic 57.7% |
| Central Americans | 0.0 /100 | #308 | Tragic 57.7% |
| Immigrants | Nicaragua | 0.0 /100 | #309 | Tragic 57.6% |
| Pueblo | 0.0 /100 | #310 | Tragic 57.4% |
| Cajuns | 0.0 /100 | #311 | Tragic 57.3% |
Demographics Similar to British by College, Under 1 year
In terms of college, under 1 year, the demographic groups most similar to British are Danish (68.5%, a difference of 0.010%), Greek (68.5%, a difference of 0.020%), Immigrants from Western Europe (68.5%, a difference of 0.040%), Laotian (68.5%, a difference of 0.040%), and Immigrants from Spain (68.4%, a difference of 0.050%).
| Demographics | Rating | Rank | College, Under 1 year |
| Lithuanians | 99.1 /100 | #70 | Exceptional 68.8% |
| Immigrants | Europe | 99.1 /100 | #71 | Exceptional 68.8% |
| Bolivians | 99.0 /100 | #72 | Exceptional 68.7% |
| Immigrants | England | 99.0 /100 | #73 | Exceptional 68.7% |
| Swedes | 98.9 /100 | #74 | Exceptional 68.7% |
| Immigrants | Western Europe | 98.6 /100 | #75 | Exceptional 68.5% |
| Laotians | 98.6 /100 | #76 | Exceptional 68.5% |
| British | 98.6 /100 | #77 | Exceptional 68.5% |
| Danes | 98.6 /100 | #78 | Exceptional 68.5% |
| Greeks | 98.6 /100 | #79 | Exceptional 68.5% |
| Immigrants | Spain | 98.5 /100 | #80 | Exceptional 68.4% |
| Immigrants | Greece | 98.5 /100 | #81 | Exceptional 68.4% |
| Norwegians | 98.4 /100 | #82 | Exceptional 68.4% |
| Argentineans | 98.4 /100 | #83 | Exceptional 68.4% |
| Immigrants | Hungary | 98.3 /100 | #84 | Exceptional 68.3% |