Kiowa vs Spaniard In Labor Force | Age 25-29
COMPARE
Kiowa
Spaniard
In Labor Force | Age 25-29
In Labor Force | Age 25-29 Comparison
Kiowa
Spaniards
81.6%
IN LABOR FORCE | AGE 25-29
0.0/ 100
METRIC RATING
322nd/ 347
METRIC RANK
83.7%
IN LABOR FORCE | AGE 25-29
0.2/ 100
METRIC RATING
254th/ 347
METRIC RANK
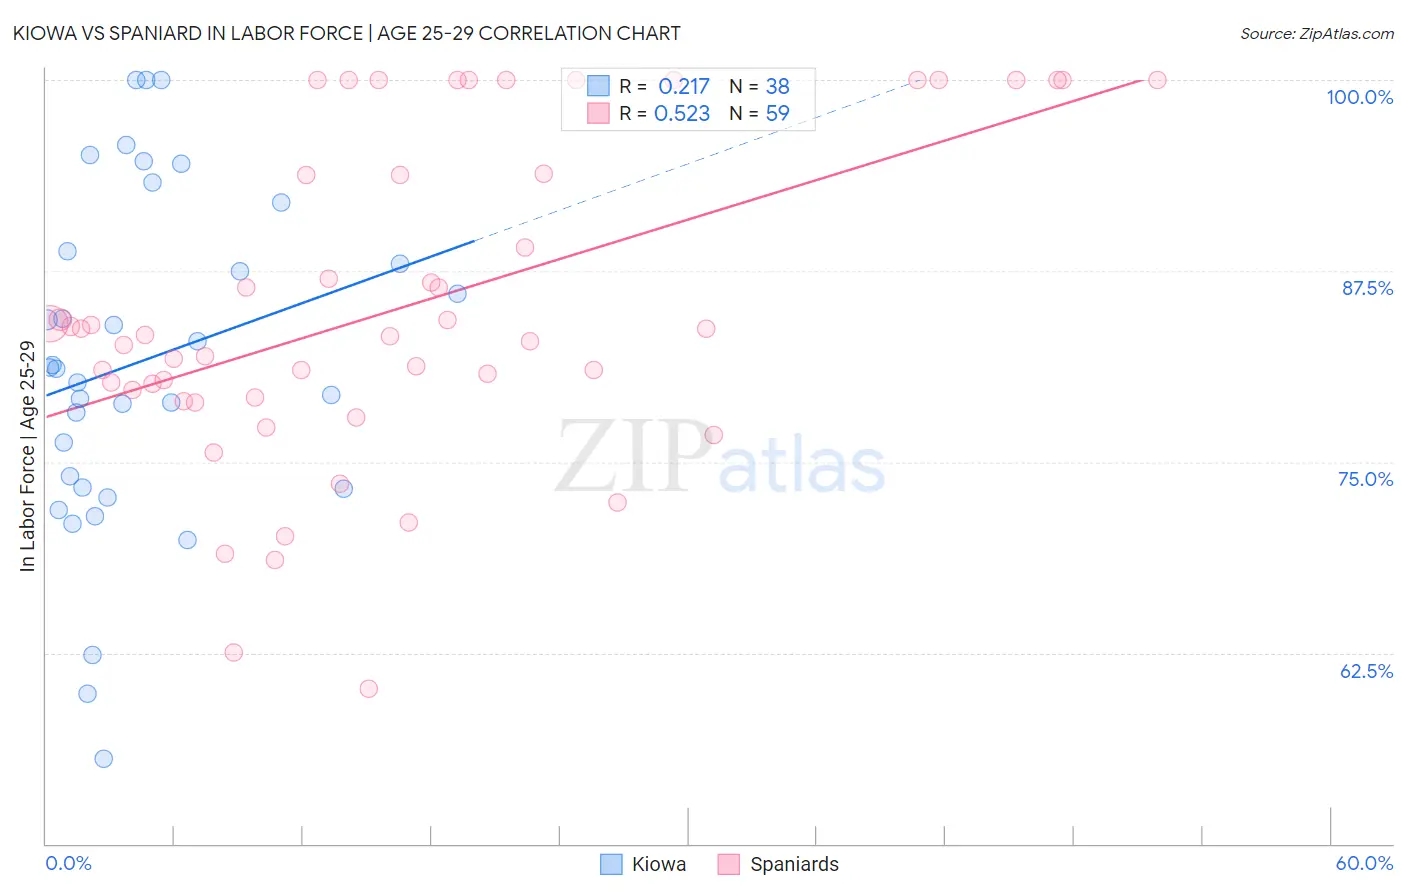
Kiowa vs Spaniard In Labor Force | Age 25-29 Correlation Chart
The statistical analysis conducted on geographies consisting of 56,097,526 people shows a weak positive correlation between the proportion of Kiowa and labor force participation rate among population between the ages 25 and 29 in the United States with a correlation coefficient (R) of 0.217 and weighted average of 81.6%. Similarly, the statistical analysis conducted on geographies consisting of 443,266,426 people shows a substantial positive correlation between the proportion of Spaniards and labor force participation rate among population between the ages 25 and 29 in the United States with a correlation coefficient (R) of 0.523 and weighted average of 83.7%, a difference of 2.6%.
In Labor Force | Age 25-29 Correlation Summary
| Measurement | Kiowa | Spaniard |
| Minimum | 55.6% | 60.2% |
| Maximum | 100.0% | 100.0% |
| Range | 44.4% | 39.8% |
| Mean | 81.6% | 85.1% |
| Median | 81.1% | 83.3% |
| Interquartile 25% (IQ1) | 73.3% | 79.2% |
| Interquartile 75% (IQ3) | 88.8% | 93.8% |
| Interquartile Range (IQR) | 15.5% | 14.6% |
| Standard Deviation (Sample) | 11.0% | 10.5% |
| Standard Deviation (Population) | 10.8% | 10.4% |
Similar Demographics by In Labor Force | Age 25-29
Demographics Similar to Kiowa by In Labor Force | Age 25-29
In terms of in labor force | age 25-29, the demographic groups most similar to Kiowa are Shoshone (81.6%, a difference of 0.010%), Alaska Native (81.6%, a difference of 0.050%), Colville (81.6%, a difference of 0.070%), Seminole (81.7%, a difference of 0.12%), and Comanche (81.9%, a difference of 0.33%).
| Demographics | Rating | Rank | In Labor Force | Age 25-29 |
| Immigrants | Mexico | 0.0 /100 | #315 | Tragic 82.0% |
| Mexicans | 0.0 /100 | #316 | Tragic 81.9% |
| Chickasaw | 0.0 /100 | #317 | Tragic 81.9% |
| Comanche | 0.0 /100 | #318 | Tragic 81.9% |
| Seminole | 0.0 /100 | #319 | Tragic 81.7% |
| Colville | 0.0 /100 | #320 | Tragic 81.6% |
| Shoshone | 0.0 /100 | #321 | Tragic 81.6% |
| Kiowa | 0.0 /100 | #322 | Tragic 81.6% |
| Alaska Natives | 0.0 /100 | #323 | Tragic 81.6% |
| Houma | 0.0 /100 | #324 | Tragic 81.2% |
| Dutch West Indians | 0.0 /100 | #325 | Tragic 81.1% |
| Choctaw | 0.0 /100 | #326 | Tragic 81.0% |
| Ute | 0.0 /100 | #327 | Tragic 80.8% |
| Creek | 0.0 /100 | #328 | Tragic 80.7% |
| Yakama | 0.0 /100 | #329 | Tragic 80.6% |
Demographics Similar to Spaniards by In Labor Force | Age 25-29
In terms of in labor force | age 25-29, the demographic groups most similar to Spaniards are Guatemalan (83.7%, a difference of 0.0%), Immigrants from Trinidad and Tobago (83.7%, a difference of 0.0%), Bahamian (83.7%, a difference of 0.010%), Haitian (83.7%, a difference of 0.010%), and Immigrants from Haiti (83.7%, a difference of 0.020%).
| Demographics | Rating | Rank | In Labor Force | Age 25-29 |
| Immigrants | El Salvador | 0.3 /100 | #247 | Tragic 83.7% |
| Immigrants | Nonimmigrants | 0.3 /100 | #248 | Tragic 83.7% |
| Hmong | 0.3 /100 | #249 | Tragic 83.7% |
| Central Americans | 0.2 /100 | #250 | Tragic 83.7% |
| Bahamians | 0.2 /100 | #251 | Tragic 83.7% |
| Guatemalans | 0.2 /100 | #252 | Tragic 83.7% |
| Immigrants | Trinidad and Tobago | 0.2 /100 | #253 | Tragic 83.7% |
| Spaniards | 0.2 /100 | #254 | Tragic 83.7% |
| Haitians | 0.2 /100 | #255 | Tragic 83.7% |
| Immigrants | Haiti | 0.2 /100 | #256 | Tragic 83.7% |
| Delaware | 0.2 /100 | #257 | Tragic 83.7% |
| Immigrants | Guatemala | 0.1 /100 | #258 | Tragic 83.6% |
| Spanish | 0.1 /100 | #259 | Tragic 83.6% |
| Immigrants | Bahamas | 0.1 /100 | #260 | Tragic 83.6% |
| Pennsylvania Germans | 0.1 /100 | #261 | Tragic 83.6% |