Jordanian vs Immigrants from Vietnam High School Diploma
COMPARE
Jordanian
Immigrants from Vietnam
High School Diploma
High School Diploma Comparison
Jordanians
Immigrants from Vietnam
90.2%
HIGH SCHOOL DIPLOMA
95.4/ 100
METRIC RATING
117th/ 347
METRIC RANK
86.2%
HIGH SCHOOL DIPLOMA
0.0/ 100
METRIC RATING
288th/ 347
METRIC RANK
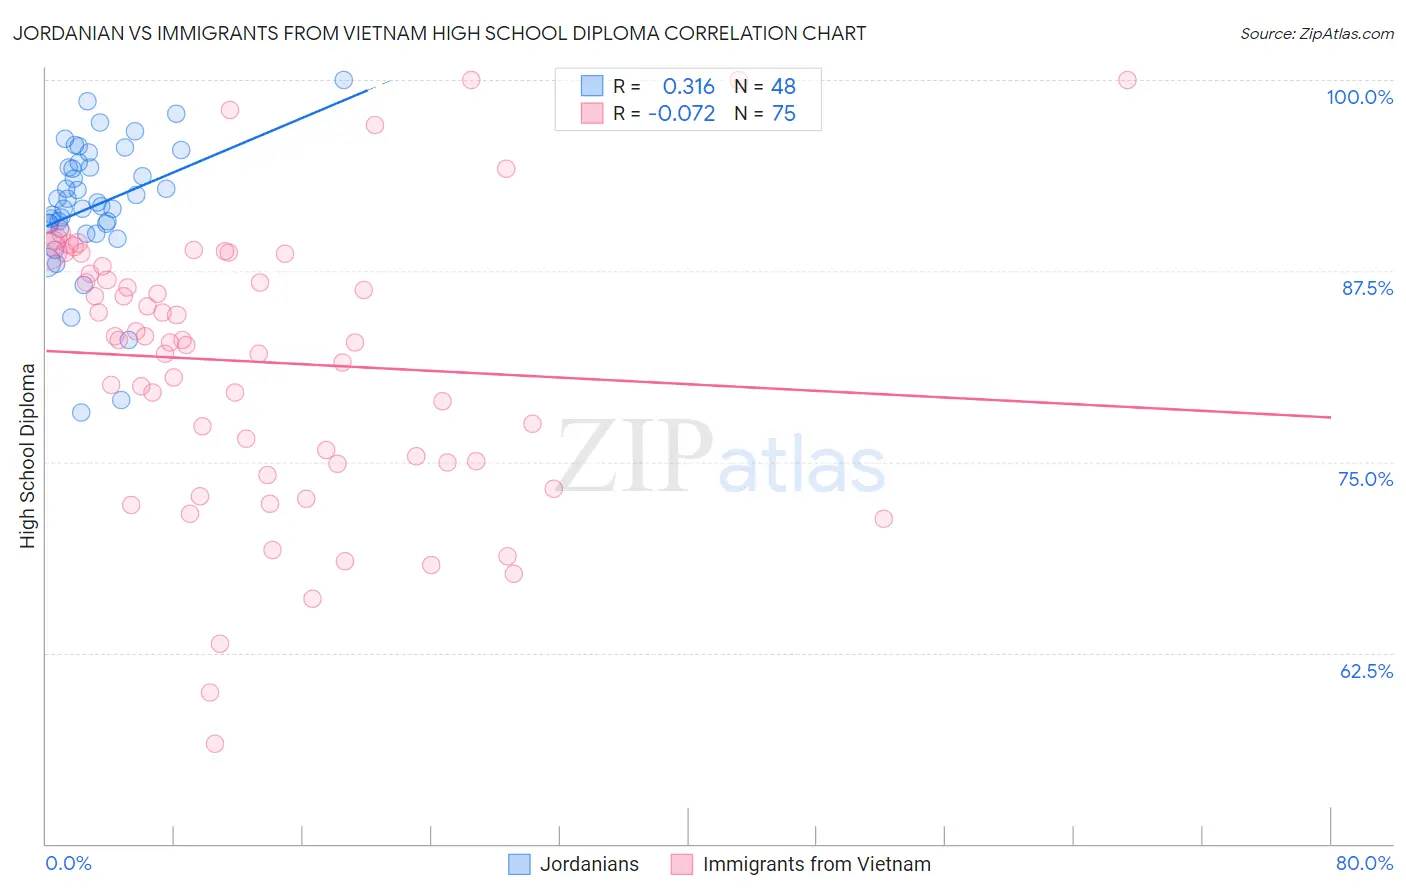
Jordanian vs Immigrants from Vietnam High School Diploma Correlation Chart
The statistical analysis conducted on geographies consisting of 166,423,935 people shows a mild positive correlation between the proportion of Jordanians and percentage of population with at least high school diploma education in the United States with a correlation coefficient (R) of 0.316 and weighted average of 90.2%. Similarly, the statistical analysis conducted on geographies consisting of 404,843,921 people shows a slight negative correlation between the proportion of Immigrants from Vietnam and percentage of population with at least high school diploma education in the United States with a correlation coefficient (R) of -0.072 and weighted average of 86.2%, a difference of 4.7%.
High School Diploma Correlation Summary
| Measurement | Jordanian | Immigrants from Vietnam |
| Minimum | 78.2% | 56.6% |
| Maximum | 100.0% | 100.0% |
| Range | 21.8% | 43.4% |
| Mean | 91.8% | 81.5% |
| Median | 91.9% | 83.0% |
| Interquartile 25% (IQ1) | 90.4% | 75.0% |
| Interquartile 75% (IQ3) | 94.5% | 88.6% |
| Interquartile Range (IQR) | 4.1% | 13.6% |
| Standard Deviation (Sample) | 4.4% | 9.2% |
| Standard Deviation (Population) | 4.3% | 9.1% |
Similar Demographics by High School Diploma
Demographics Similar to Jordanians by High School Diploma
In terms of high school diploma, the demographic groups most similar to Jordanians are Israeli (90.1%, a difference of 0.020%), Immigrants from Germany (90.2%, a difference of 0.030%), Immigrants from Hungary (90.2%, a difference of 0.040%), Immigrants from Eastern Europe (90.1%, a difference of 0.040%), and Ottawa (90.1%, a difference of 0.070%).
| Demographics | Rating | Rank | High School Diploma |
| Immigrants | Greece | 96.6 /100 | #110 | Exceptional 90.3% |
| Menominee | 96.6 /100 | #111 | Exceptional 90.3% |
| Immigrants | Belarus | 96.4 /100 | #112 | Exceptional 90.2% |
| Immigrants | Sri Lanka | 96.3 /100 | #113 | Exceptional 90.2% |
| Yugoslavians | 96.2 /100 | #114 | Exceptional 90.2% |
| Immigrants | Hungary | 95.8 /100 | #115 | Exceptional 90.2% |
| Immigrants | Germany | 95.7 /100 | #116 | Exceptional 90.2% |
| Jordanians | 95.4 /100 | #117 | Exceptional 90.2% |
| Israelis | 95.1 /100 | #118 | Exceptional 90.1% |
| Immigrants | Eastern Europe | 94.9 /100 | #119 | Exceptional 90.1% |
| Ottawa | 94.4 /100 | #120 | Exceptional 90.1% |
| Whites/Caucasians | 94.1 /100 | #121 | Exceptional 90.1% |
| Immigrants | Kazakhstan | 93.4 /100 | #122 | Exceptional 90.0% |
| German Russians | 92.0 /100 | #123 | Exceptional 90.0% |
| Mongolians | 91.6 /100 | #124 | Exceptional 89.9% |
Demographics Similar to Immigrants from Vietnam by High School Diploma
In terms of high school diploma, the demographic groups most similar to Immigrants from Vietnam are Ute (86.2%, a difference of 0.0%), Immigrants from St. Vincent and the Grenadines (86.2%, a difference of 0.040%), Immigrants from West Indies (86.2%, a difference of 0.060%), Yup'ik (86.1%, a difference of 0.11%), and Fijian (86.0%, a difference of 0.18%).
| Demographics | Rating | Rank | High School Diploma |
| Indonesians | 0.0 /100 | #281 | Tragic 86.5% |
| Dutch West Indians | 0.0 /100 | #282 | Tragic 86.5% |
| Immigrants | Barbados | 0.0 /100 | #283 | Tragic 86.4% |
| Paiute | 0.0 /100 | #284 | Tragic 86.4% |
| Immigrants | West Indies | 0.0 /100 | #285 | Tragic 86.2% |
| Immigrants | St. Vincent and the Grenadines | 0.0 /100 | #286 | Tragic 86.2% |
| Ute | 0.0 /100 | #287 | Tragic 86.2% |
| Immigrants | Vietnam | 0.0 /100 | #288 | Tragic 86.2% |
| Yup'ik | 0.0 /100 | #289 | Tragic 86.1% |
| Fijians | 0.0 /100 | #290 | Tragic 86.0% |
| Haitians | 0.0 /100 | #291 | Tragic 85.9% |
| Japanese | 0.0 /100 | #292 | Tragic 85.9% |
| British West Indians | 0.0 /100 | #293 | Tragic 85.9% |
| Immigrants | Fiji | 0.0 /100 | #294 | Tragic 85.8% |
| Immigrants | Immigrants | 0.0 /100 | #295 | Tragic 85.8% |