Jordanian vs Immigrants from Dominican Republic High School Diploma
COMPARE
Jordanian
Immigrants from Dominican Republic
High School Diploma
High School Diploma Comparison
Jordanians
Immigrants from Dominican Republic
90.2%
HIGH SCHOOL DIPLOMA
95.4/ 100
METRIC RATING
117th/ 347
METRIC RANK
82.0%
HIGH SCHOOL DIPLOMA
0.0/ 100
METRIC RATING
336th/ 347
METRIC RANK
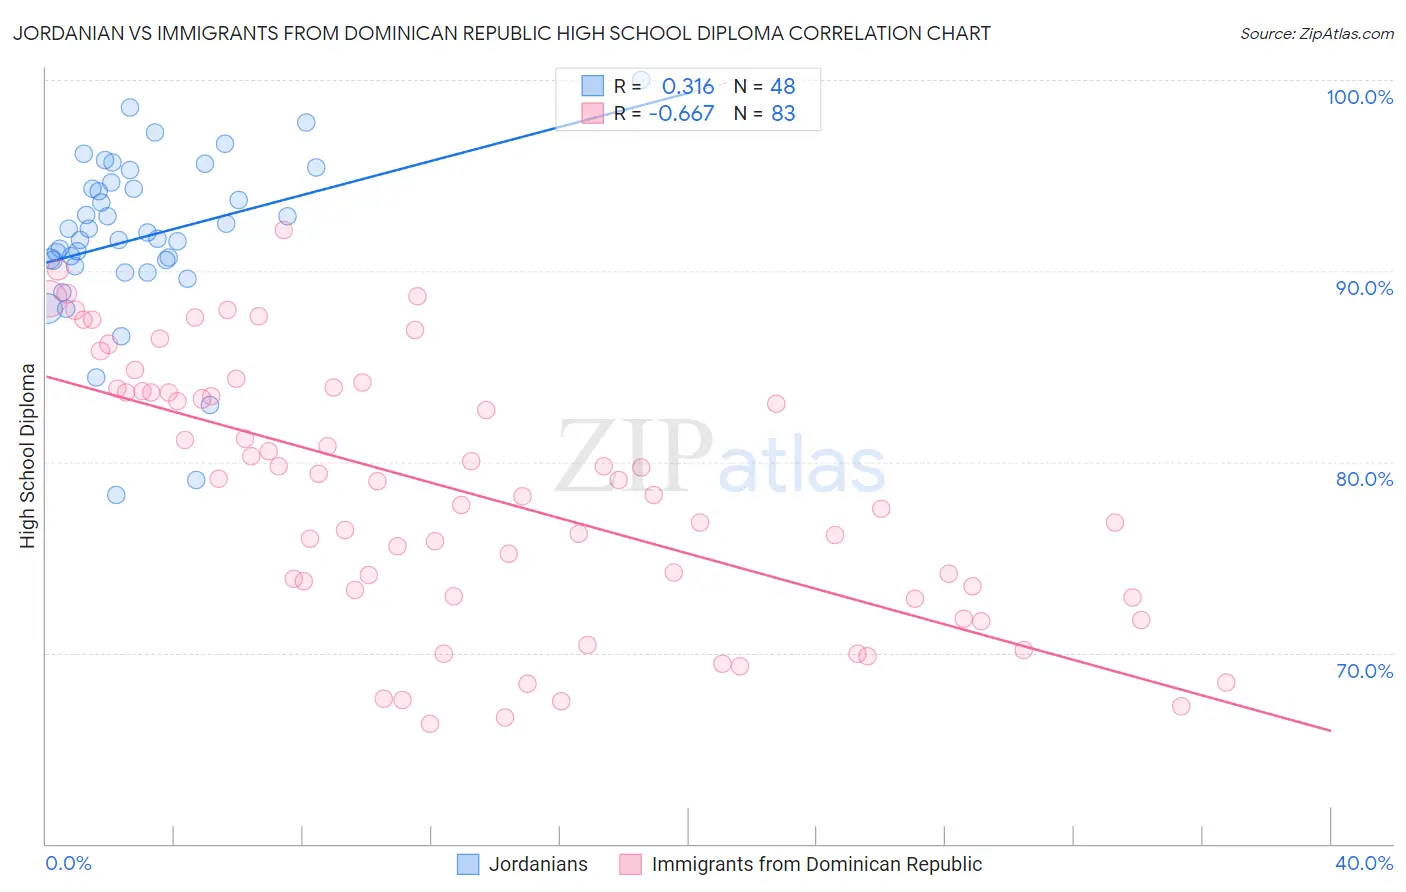
Jordanian vs Immigrants from Dominican Republic High School Diploma Correlation Chart
The statistical analysis conducted on geographies consisting of 166,423,935 people shows a mild positive correlation between the proportion of Jordanians and percentage of population with at least high school diploma education in the United States with a correlation coefficient (R) of 0.316 and weighted average of 90.2%. Similarly, the statistical analysis conducted on geographies consisting of 275,144,349 people shows a significant negative correlation between the proportion of Immigrants from Dominican Republic and percentage of population with at least high school diploma education in the United States with a correlation coefficient (R) of -0.667 and weighted average of 82.0%, a difference of 10.0%.
High School Diploma Correlation Summary
| Measurement | Jordanian | Immigrants from Dominican Republic |
| Minimum | 78.2% | 66.3% |
| Maximum | 100.0% | 92.2% |
| Range | 21.8% | 25.9% |
| Mean | 91.8% | 78.4% |
| Median | 91.9% | 79.0% |
| Interquartile 25% (IQ1) | 90.4% | 73.0% |
| Interquartile 75% (IQ3) | 94.5% | 83.7% |
| Interquartile Range (IQR) | 4.1% | 10.8% |
| Standard Deviation (Sample) | 4.4% | 6.8% |
| Standard Deviation (Population) | 4.3% | 6.7% |
Similar Demographics by High School Diploma
Demographics Similar to Jordanians by High School Diploma
In terms of high school diploma, the demographic groups most similar to Jordanians are Israeli (90.1%, a difference of 0.020%), Immigrants from Germany (90.2%, a difference of 0.030%), Immigrants from Hungary (90.2%, a difference of 0.040%), Immigrants from Eastern Europe (90.1%, a difference of 0.040%), and Ottawa (90.1%, a difference of 0.070%).
| Demographics | Rating | Rank | High School Diploma |
| Immigrants | Greece | 96.6 /100 | #110 | Exceptional 90.3% |
| Menominee | 96.6 /100 | #111 | Exceptional 90.3% |
| Immigrants | Belarus | 96.4 /100 | #112 | Exceptional 90.2% |
| Immigrants | Sri Lanka | 96.3 /100 | #113 | Exceptional 90.2% |
| Yugoslavians | 96.2 /100 | #114 | Exceptional 90.2% |
| Immigrants | Hungary | 95.8 /100 | #115 | Exceptional 90.2% |
| Immigrants | Germany | 95.7 /100 | #116 | Exceptional 90.2% |
| Jordanians | 95.4 /100 | #117 | Exceptional 90.2% |
| Israelis | 95.1 /100 | #118 | Exceptional 90.1% |
| Immigrants | Eastern Europe | 94.9 /100 | #119 | Exceptional 90.1% |
| Ottawa | 94.4 /100 | #120 | Exceptional 90.1% |
| Whites/Caucasians | 94.1 /100 | #121 | Exceptional 90.1% |
| Immigrants | Kazakhstan | 93.4 /100 | #122 | Exceptional 90.0% |
| German Russians | 92.0 /100 | #123 | Exceptional 90.0% |
| Mongolians | 91.6 /100 | #124 | Exceptional 89.9% |
Demographics Similar to Immigrants from Dominican Republic by High School Diploma
In terms of high school diploma, the demographic groups most similar to Immigrants from Dominican Republic are Guatemalan (82.0%, a difference of 0.010%), Tohono O'odham (82.1%, a difference of 0.12%), Immigrants from Yemen (81.8%, a difference of 0.15%), Immigrants from Latin America (82.1%, a difference of 0.23%), and Salvadoran (81.7%, a difference of 0.32%).
| Demographics | Rating | Rank | High School Diploma |
| Hispanics or Latinos | 0.0 /100 | #329 | Tragic 82.9% |
| Immigrants | Azores | 0.0 /100 | #330 | Tragic 82.8% |
| Central Americans | 0.0 /100 | #331 | Tragic 82.5% |
| Immigrants | Honduras | 0.0 /100 | #332 | Tragic 82.5% |
| Immigrants | Latin America | 0.0 /100 | #333 | Tragic 82.1% |
| Tohono O'odham | 0.0 /100 | #334 | Tragic 82.1% |
| Guatemalans | 0.0 /100 | #335 | Tragic 82.0% |
| Immigrants | Dominican Republic | 0.0 /100 | #336 | Tragic 82.0% |
| Immigrants | Yemen | 0.0 /100 | #337 | Tragic 81.8% |
| Salvadorans | 0.0 /100 | #338 | Tragic 81.7% |
| Pima | 0.0 /100 | #339 | Tragic 81.6% |
| Houma | 0.0 /100 | #340 | Tragic 81.5% |
| Mexicans | 0.0 /100 | #341 | Tragic 81.4% |
| Immigrants | Guatemala | 0.0 /100 | #342 | Tragic 81.4% |
| Immigrants | El Salvador | 0.0 /100 | #343 | Tragic 80.8% |