Jordanian vs Spanish American High School Diploma
COMPARE
Jordanian
Spanish American
High School Diploma
High School Diploma Comparison
Jordanians
Spanish Americans
90.2%
HIGH SCHOOL DIPLOMA
95.4/ 100
METRIC RATING
117th/ 347
METRIC RANK
87.7%
HIGH SCHOOL DIPLOMA
1.5/ 100
METRIC RATING
248th/ 347
METRIC RANK
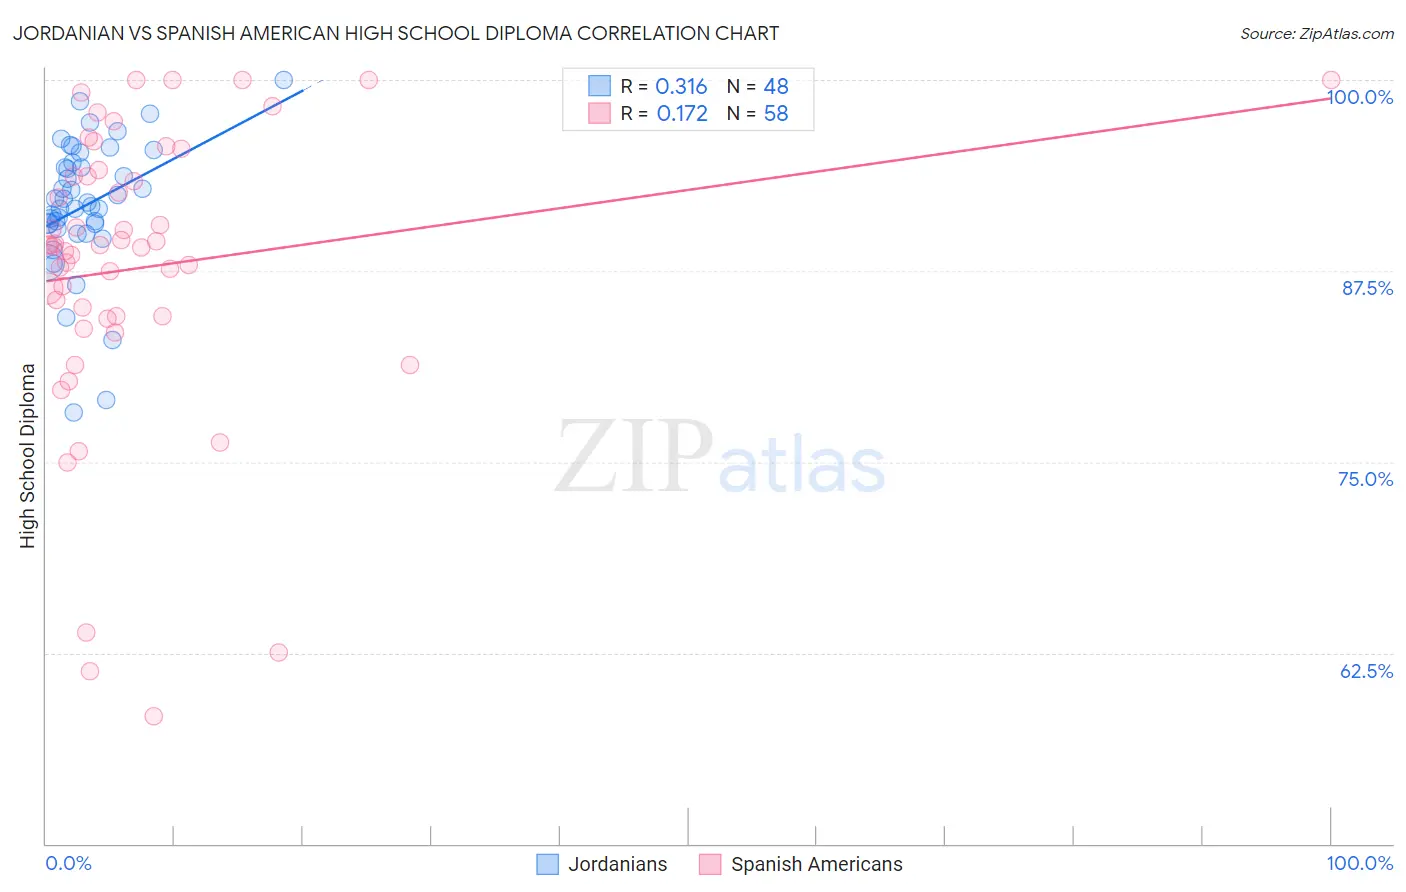
Jordanian vs Spanish American High School Diploma Correlation Chart
The statistical analysis conducted on geographies consisting of 166,423,935 people shows a mild positive correlation between the proportion of Jordanians and percentage of population with at least high school diploma education in the United States with a correlation coefficient (R) of 0.316 and weighted average of 90.2%. Similarly, the statistical analysis conducted on geographies consisting of 103,166,592 people shows a poor positive correlation between the proportion of Spanish Americans and percentage of population with at least high school diploma education in the United States with a correlation coefficient (R) of 0.172 and weighted average of 87.7%, a difference of 2.8%.
High School Diploma Correlation Summary
| Measurement | Jordanian | Spanish American |
| Minimum | 78.2% | 58.3% |
| Maximum | 100.0% | 100.0% |
| Range | 21.8% | 41.7% |
| Mean | 91.8% | 87.7% |
| Median | 91.9% | 89.2% |
| Interquartile 25% (IQ1) | 90.4% | 84.5% |
| Interquartile 75% (IQ3) | 94.5% | 93.7% |
| Interquartile Range (IQR) | 4.1% | 9.2% |
| Standard Deviation (Sample) | 4.4% | 9.5% |
| Standard Deviation (Population) | 4.3% | 9.5% |
Similar Demographics by High School Diploma
Demographics Similar to Jordanians by High School Diploma
In terms of high school diploma, the demographic groups most similar to Jordanians are Israeli (90.1%, a difference of 0.020%), Immigrants from Germany (90.2%, a difference of 0.030%), Immigrants from Hungary (90.2%, a difference of 0.040%), Immigrants from Eastern Europe (90.1%, a difference of 0.040%), and Ottawa (90.1%, a difference of 0.070%).
| Demographics | Rating | Rank | High School Diploma |
| Immigrants | Greece | 96.6 /100 | #110 | Exceptional 90.3% |
| Menominee | 96.6 /100 | #111 | Exceptional 90.3% |
| Immigrants | Belarus | 96.4 /100 | #112 | Exceptional 90.2% |
| Immigrants | Sri Lanka | 96.3 /100 | #113 | Exceptional 90.2% |
| Yugoslavians | 96.2 /100 | #114 | Exceptional 90.2% |
| Immigrants | Hungary | 95.8 /100 | #115 | Exceptional 90.2% |
| Immigrants | Germany | 95.7 /100 | #116 | Exceptional 90.2% |
| Jordanians | 95.4 /100 | #117 | Exceptional 90.2% |
| Israelis | 95.1 /100 | #118 | Exceptional 90.1% |
| Immigrants | Eastern Europe | 94.9 /100 | #119 | Exceptional 90.1% |
| Ottawa | 94.4 /100 | #120 | Exceptional 90.1% |
| Whites/Caucasians | 94.1 /100 | #121 | Exceptional 90.1% |
| Immigrants | Kazakhstan | 93.4 /100 | #122 | Exceptional 90.0% |
| German Russians | 92.0 /100 | #123 | Exceptional 90.0% |
| Mongolians | 91.6 /100 | #124 | Exceptional 89.9% |
Demographics Similar to Spanish Americans by High School Diploma
In terms of high school diploma, the demographic groups most similar to Spanish Americans are Senegalese (87.7%, a difference of 0.010%), Immigrants from Nigeria (87.7%, a difference of 0.010%), Immigrants from Eritrea (87.8%, a difference of 0.040%), Immigrants from Costa Rica (87.8%, a difference of 0.040%), and Ghanaian (87.7%, a difference of 0.050%).
| Demographics | Rating | Rank | High School Diploma |
| Immigrants | Uzbekistan | 2.1 /100 | #241 | Tragic 87.8% |
| Cheyenne | 2.1 /100 | #242 | Tragic 87.8% |
| Immigrants | Philippines | 1.9 /100 | #243 | Tragic 87.8% |
| Choctaw | 1.9 /100 | #244 | Tragic 87.8% |
| Peruvians | 1.9 /100 | #245 | Tragic 87.8% |
| Immigrants | Eritrea | 1.7 /100 | #246 | Tragic 87.8% |
| Immigrants | Costa Rica | 1.7 /100 | #247 | Tragic 87.8% |
| Spanish Americans | 1.5 /100 | #248 | Tragic 87.7% |
| Senegalese | 1.5 /100 | #249 | Tragic 87.7% |
| Immigrants | Nigeria | 1.5 /100 | #250 | Tragic 87.7% |
| Ghanaians | 1.4 /100 | #251 | Tragic 87.7% |
| Immigrants | South America | 1.2 /100 | #252 | Tragic 87.6% |
| Immigrants | Uruguay | 1.0 /100 | #253 | Tragic 87.6% |
| Immigrants | Colombia | 1.0 /100 | #254 | Tragic 87.6% |
| Immigrants | Senegal | 0.9 /100 | #255 | Tragic 87.6% |