Inupiat vs Immigrants from Vietnam High School Diploma
COMPARE
Inupiat
Immigrants from Vietnam
High School Diploma
High School Diploma Comparison
Inupiat
Immigrants from Vietnam
88.5%
HIGH SCHOOL DIPLOMA
13.1/ 100
METRIC RATING
211th/ 347
METRIC RANK
86.2%
HIGH SCHOOL DIPLOMA
0.0/ 100
METRIC RATING
288th/ 347
METRIC RANK
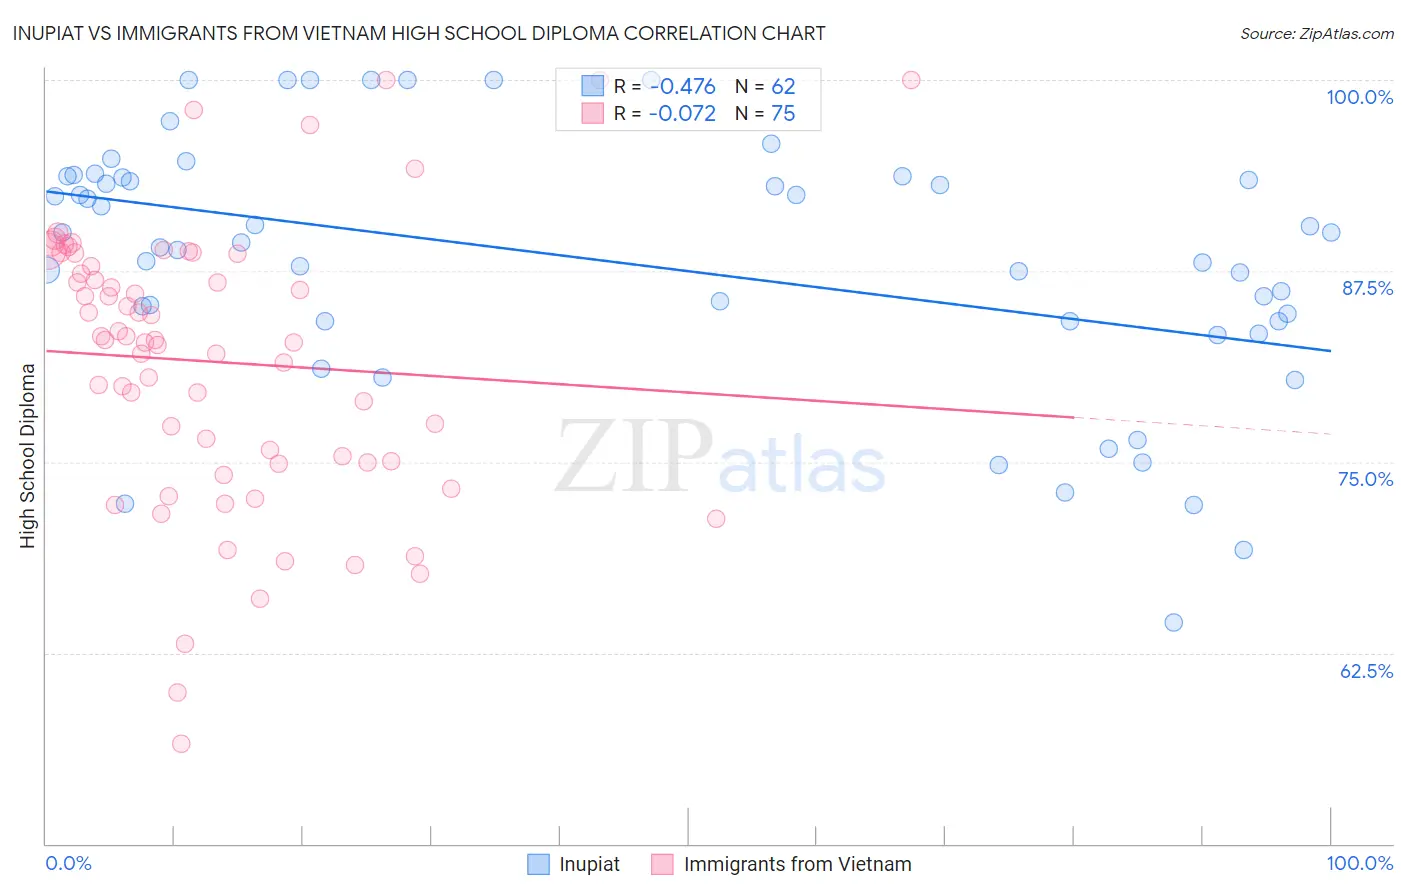
Inupiat vs Immigrants from Vietnam High School Diploma Correlation Chart
The statistical analysis conducted on geographies consisting of 96,349,180 people shows a moderate negative correlation between the proportion of Inupiat and percentage of population with at least high school diploma education in the United States with a correlation coefficient (R) of -0.476 and weighted average of 88.5%. Similarly, the statistical analysis conducted on geographies consisting of 404,843,921 people shows a slight negative correlation between the proportion of Immigrants from Vietnam and percentage of population with at least high school diploma education in the United States with a correlation coefficient (R) of -0.072 and weighted average of 86.2%, a difference of 2.7%.
High School Diploma Correlation Summary
| Measurement | Inupiat | Immigrants from Vietnam |
| Minimum | 64.5% | 56.6% |
| Maximum | 100.0% | 100.0% |
| Range | 35.5% | 43.4% |
| Mean | 88.1% | 81.5% |
| Median | 89.2% | 83.0% |
| Interquartile 25% (IQ1) | 84.2% | 75.0% |
| Interquartile 75% (IQ3) | 93.6% | 88.6% |
| Interquartile Range (IQR) | 9.4% | 13.6% |
| Standard Deviation (Sample) | 8.3% | 9.2% |
| Standard Deviation (Population) | 8.2% | 9.1% |
Similar Demographics by High School Diploma
Demographics Similar to Inupiat by High School Diploma
In terms of high school diploma, the demographic groups most similar to Inupiat are Samoan (88.5%, a difference of 0.030%), South American Indian (88.5%, a difference of 0.030%), Portuguese (88.5%, a difference of 0.040%), Cherokee (88.5%, a difference of 0.040%), and Immigrants from Somalia (88.4%, a difference of 0.070%).
| Demographics | Rating | Rank | High School Diploma |
| Armenians | 17.2 /100 | #204 | Poor 88.6% |
| Immigrants | Micronesia | 16.4 /100 | #205 | Poor 88.6% |
| Arapaho | 16.1 /100 | #206 | Poor 88.6% |
| Immigrants | Sierra Leone | 15.8 /100 | #207 | Poor 88.6% |
| Portuguese | 14.4 /100 | #208 | Poor 88.5% |
| Cherokee | 14.3 /100 | #209 | Poor 88.5% |
| Samoans | 14.0 /100 | #210 | Poor 88.5% |
| Inupiat | 13.1 /100 | #211 | Poor 88.5% |
| South American Indians | 12.2 /100 | #212 | Poor 88.5% |
| Immigrants | Somalia | 11.3 /100 | #213 | Poor 88.4% |
| Immigrants | Cameroon | 10.9 /100 | #214 | Poor 88.4% |
| Crow | 10.9 /100 | #215 | Poor 88.4% |
| Chickasaw | 10.7 /100 | #216 | Poor 88.4% |
| Immigrants | Africa | 10.6 /100 | #217 | Poor 88.4% |
| Immigrants | Bolivia | 10.3 /100 | #218 | Poor 88.4% |
Demographics Similar to Immigrants from Vietnam by High School Diploma
In terms of high school diploma, the demographic groups most similar to Immigrants from Vietnam are Ute (86.2%, a difference of 0.0%), Immigrants from St. Vincent and the Grenadines (86.2%, a difference of 0.040%), Immigrants from West Indies (86.2%, a difference of 0.060%), Yup'ik (86.1%, a difference of 0.11%), and Fijian (86.0%, a difference of 0.18%).
| Demographics | Rating | Rank | High School Diploma |
| Indonesians | 0.0 /100 | #281 | Tragic 86.5% |
| Dutch West Indians | 0.0 /100 | #282 | Tragic 86.5% |
| Immigrants | Barbados | 0.0 /100 | #283 | Tragic 86.4% |
| Paiute | 0.0 /100 | #284 | Tragic 86.4% |
| Immigrants | West Indies | 0.0 /100 | #285 | Tragic 86.2% |
| Immigrants | St. Vincent and the Grenadines | 0.0 /100 | #286 | Tragic 86.2% |
| Ute | 0.0 /100 | #287 | Tragic 86.2% |
| Immigrants | Vietnam | 0.0 /100 | #288 | Tragic 86.2% |
| Yup'ik | 0.0 /100 | #289 | Tragic 86.1% |
| Fijians | 0.0 /100 | #290 | Tragic 86.0% |
| Haitians | 0.0 /100 | #291 | Tragic 85.9% |
| Japanese | 0.0 /100 | #292 | Tragic 85.9% |
| British West Indians | 0.0 /100 | #293 | Tragic 85.9% |
| Immigrants | Fiji | 0.0 /100 | #294 | Tragic 85.8% |
| Immigrants | Immigrants | 0.0 /100 | #295 | Tragic 85.8% |