Scandinavian vs Immigrants from Vietnam High School Diploma
COMPARE
Scandinavian
Immigrants from Vietnam
High School Diploma
High School Diploma Comparison
Scandinavians
Immigrants from Vietnam
91.5%
HIGH SCHOOL DIPLOMA
99.9/ 100
METRIC RATING
23rd/ 347
METRIC RANK
86.2%
HIGH SCHOOL DIPLOMA
0.0/ 100
METRIC RATING
288th/ 347
METRIC RANK
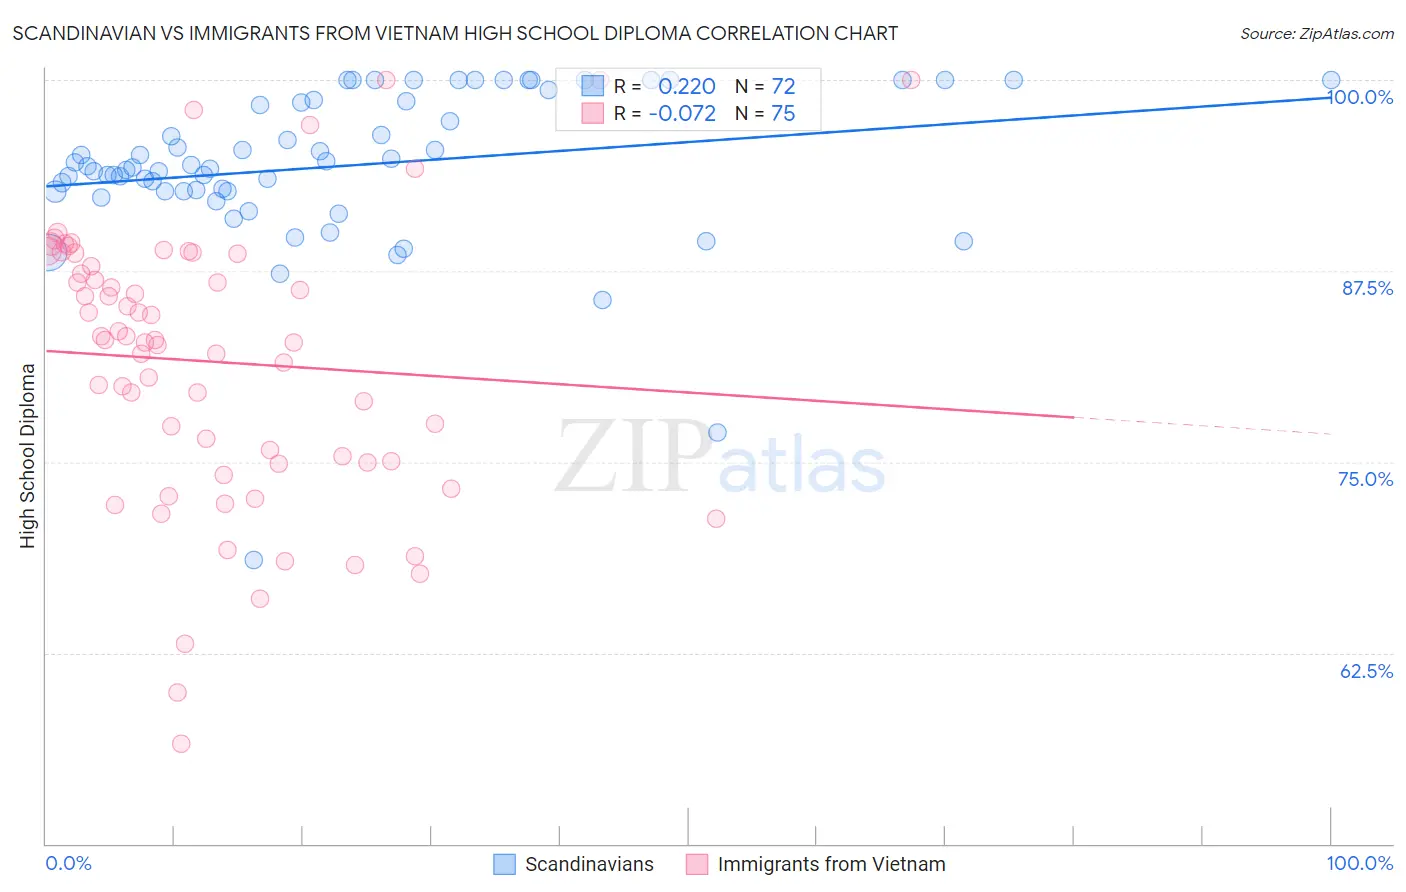
Scandinavian vs Immigrants from Vietnam High School Diploma Correlation Chart
The statistical analysis conducted on geographies consisting of 472,659,475 people shows a weak positive correlation between the proportion of Scandinavians and percentage of population with at least high school diploma education in the United States with a correlation coefficient (R) of 0.220 and weighted average of 91.5%. Similarly, the statistical analysis conducted on geographies consisting of 404,843,921 people shows a slight negative correlation between the proportion of Immigrants from Vietnam and percentage of population with at least high school diploma education in the United States with a correlation coefficient (R) of -0.072 and weighted average of 86.2%, a difference of 6.2%.
High School Diploma Correlation Summary
| Measurement | Scandinavian | Immigrants from Vietnam |
| Minimum | 68.6% | 56.6% |
| Maximum | 100.0% | 100.0% |
| Range | 31.4% | 43.4% |
| Mean | 94.4% | 81.5% |
| Median | 94.3% | 83.0% |
| Interquartile 25% (IQ1) | 92.7% | 75.0% |
| Interquartile 75% (IQ3) | 98.6% | 88.6% |
| Interquartile Range (IQR) | 5.9% | 13.6% |
| Standard Deviation (Sample) | 5.3% | 9.2% |
| Standard Deviation (Population) | 5.2% | 9.1% |
Similar Demographics by High School Diploma
Demographics Similar to Scandinavians by High School Diploma
In terms of high school diploma, the demographic groups most similar to Scandinavians are Italian (91.5%, a difference of 0.0%), Thai (91.5%, a difference of 0.0%), Estonian (91.6%, a difference of 0.030%), Filipino (91.6%, a difference of 0.040%), and Czech (91.6%, a difference of 0.050%).
| Demographics | Rating | Rank | High School Diploma |
| Finns | 100.0 /100 | #16 | Exceptional 91.7% |
| Immigrants | Singapore | 99.9 /100 | #17 | Exceptional 91.7% |
| Germans | 99.9 /100 | #18 | Exceptional 91.7% |
| Maltese | 99.9 /100 | #19 | Exceptional 91.6% |
| Czechs | 99.9 /100 | #20 | Exceptional 91.6% |
| Filipinos | 99.9 /100 | #21 | Exceptional 91.6% |
| Estonians | 99.9 /100 | #22 | Exceptional 91.6% |
| Scandinavians | 99.9 /100 | #23 | Exceptional 91.5% |
| Italians | 99.9 /100 | #24 | Exceptional 91.5% |
| Thais | 99.9 /100 | #25 | Exceptional 91.5% |
| Russians | 99.9 /100 | #26 | Exceptional 91.5% |
| Cypriots | 99.9 /100 | #27 | Exceptional 91.5% |
| Tlingit-Haida | 99.9 /100 | #28 | Exceptional 91.4% |
| Europeans | 99.9 /100 | #29 | Exceptional 91.4% |
| Iranians | 99.9 /100 | #30 | Exceptional 91.4% |
Demographics Similar to Immigrants from Vietnam by High School Diploma
In terms of high school diploma, the demographic groups most similar to Immigrants from Vietnam are Ute (86.2%, a difference of 0.0%), Immigrants from St. Vincent and the Grenadines (86.2%, a difference of 0.040%), Immigrants from West Indies (86.2%, a difference of 0.060%), Yup'ik (86.1%, a difference of 0.11%), and Fijian (86.0%, a difference of 0.18%).
| Demographics | Rating | Rank | High School Diploma |
| Indonesians | 0.0 /100 | #281 | Tragic 86.5% |
| Dutch West Indians | 0.0 /100 | #282 | Tragic 86.5% |
| Immigrants | Barbados | 0.0 /100 | #283 | Tragic 86.4% |
| Paiute | 0.0 /100 | #284 | Tragic 86.4% |
| Immigrants | West Indies | 0.0 /100 | #285 | Tragic 86.2% |
| Immigrants | St. Vincent and the Grenadines | 0.0 /100 | #286 | Tragic 86.2% |
| Ute | 0.0 /100 | #287 | Tragic 86.2% |
| Immigrants | Vietnam | 0.0 /100 | #288 | Tragic 86.2% |
| Yup'ik | 0.0 /100 | #289 | Tragic 86.1% |
| Fijians | 0.0 /100 | #290 | Tragic 86.0% |
| Haitians | 0.0 /100 | #291 | Tragic 85.9% |
| Japanese | 0.0 /100 | #292 | Tragic 85.9% |
| British West Indians | 0.0 /100 | #293 | Tragic 85.9% |
| Immigrants | Fiji | 0.0 /100 | #294 | Tragic 85.8% |
| Immigrants | Immigrants | 0.0 /100 | #295 | Tragic 85.8% |