Jordanian vs Immigrants from Vietnam Male Disability
COMPARE
Jordanian
Immigrants from Vietnam
Male Disability
Male Disability Comparison
Jordanians
Immigrants from Vietnam
10.5%
MALE DISABILITY
99.3/ 100
METRIC RATING
64th/ 347
METRIC RANK
10.6%
MALE DISABILITY
97.9/ 100
METRIC RATING
87th/ 347
METRIC RANK
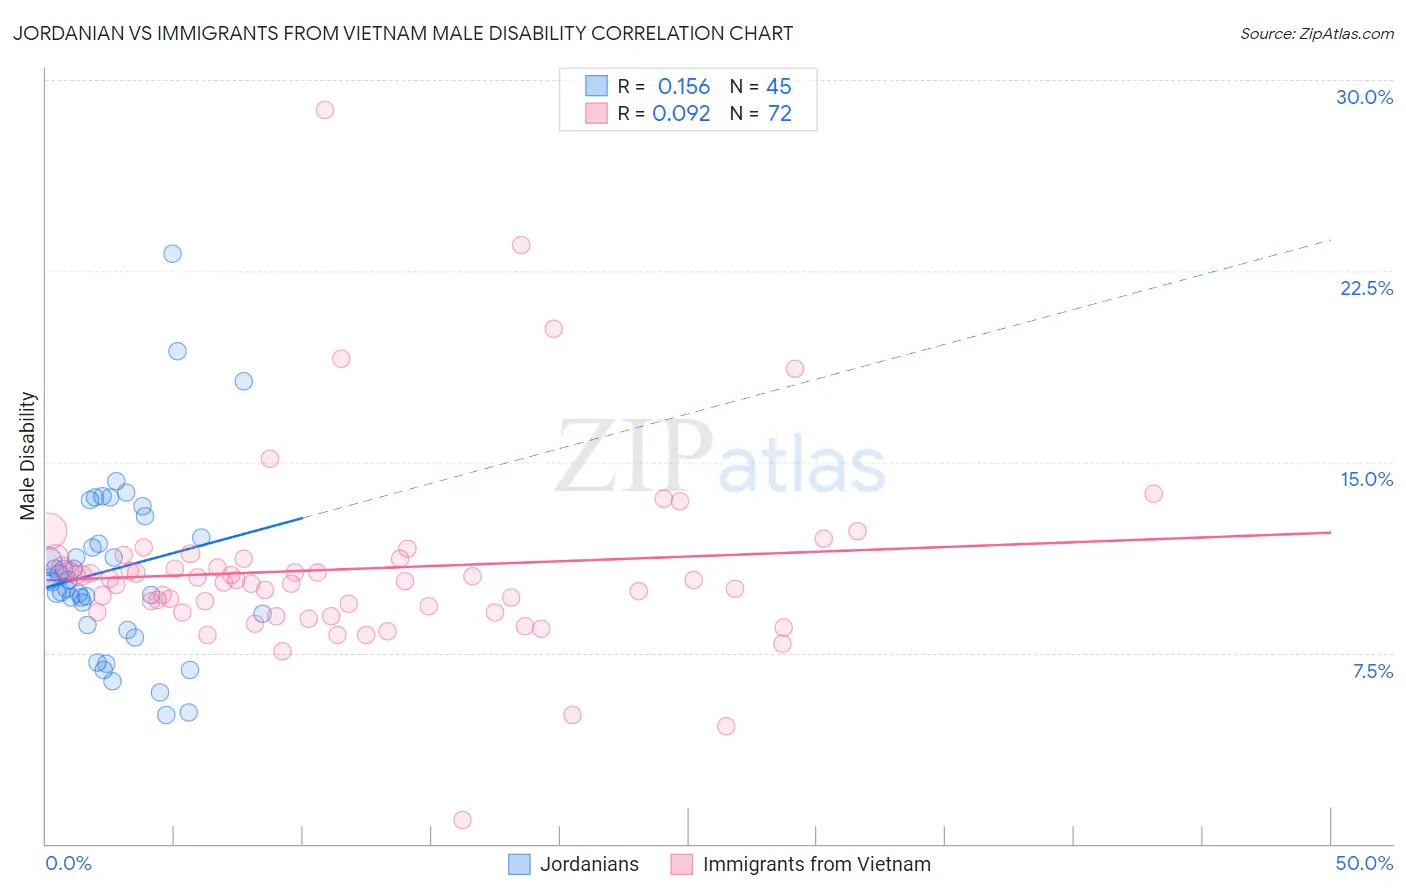
Jordanian vs Immigrants from Vietnam Male Disability Correlation Chart
The statistical analysis conducted on geographies consisting of 166,415,761 people shows a poor positive correlation between the proportion of Jordanians and percentage of males with a disability in the United States with a correlation coefficient (R) of 0.156 and weighted average of 10.5%. Similarly, the statistical analysis conducted on geographies consisting of 404,767,194 people shows a slight positive correlation between the proportion of Immigrants from Vietnam and percentage of males with a disability in the United States with a correlation coefficient (R) of 0.092 and weighted average of 10.6%, a difference of 1.6%.
Male Disability Correlation Summary
| Measurement | Jordanian | Immigrants from Vietnam |
| Minimum | 5.0% | 0.96% |
| Maximum | 23.2% | 28.8% |
| Range | 18.1% | 27.9% |
| Mean | 10.8% | 10.8% |
| Median | 10.4% | 10.3% |
| Interquartile 25% (IQ1) | 8.8% | 9.1% |
| Interquartile 75% (IQ3) | 12.4% | 11.2% |
| Interquartile Range (IQR) | 3.6% | 2.1% |
| Standard Deviation (Sample) | 3.5% | 3.8% |
| Standard Deviation (Population) | 3.5% | 3.8% |
Similar Demographics by Male Disability
Demographics Similar to Jordanians by Male Disability
In terms of male disability, the demographic groups most similar to Jordanians are Immigrants from Grenada (10.5%, a difference of 0.020%), Guyanese (10.5%, a difference of 0.030%), Immigrants from Afghanistan (10.5%, a difference of 0.030%), Immigrants from Belarus (10.4%, a difference of 0.12%), and Colombian (10.5%, a difference of 0.13%).
| Demographics | Rating | Rank | Male Disability |
| Immigrants | South America | 99.6 /100 | #57 | Exceptional 10.4% |
| Immigrants | Japan | 99.5 /100 | #58 | Exceptional 10.4% |
| Immigrants | Australia | 99.5 /100 | #59 | Exceptional 10.4% |
| Immigrants | Colombia | 99.5 /100 | #60 | Exceptional 10.4% |
| Immigrants | Northern Africa | 99.4 /100 | #61 | Exceptional 10.4% |
| Immigrants | Ecuador | 99.3 /100 | #62 | Exceptional 10.4% |
| Immigrants | Belarus | 99.3 /100 | #63 | Exceptional 10.4% |
| Jordanians | 99.3 /100 | #64 | Exceptional 10.5% |
| Immigrants | Grenada | 99.2 /100 | #65 | Exceptional 10.5% |
| Guyanese | 99.2 /100 | #66 | Exceptional 10.5% |
| Immigrants | Afghanistan | 99.2 /100 | #67 | Exceptional 10.5% |
| Colombians | 99.2 /100 | #68 | Exceptional 10.5% |
| Ecuadorians | 99.2 /100 | #69 | Exceptional 10.5% |
| Immigrants | Bulgaria | 99.1 /100 | #70 | Exceptional 10.5% |
| Immigrants | Cameroon | 99.0 /100 | #71 | Exceptional 10.5% |
Demographics Similar to Immigrants from Vietnam by Male Disability
In terms of male disability, the demographic groups most similar to Immigrants from Vietnam are Immigrants from Ireland (10.6%, a difference of 0.020%), Sri Lankan (10.6%, a difference of 0.030%), Immigrants from Western Asia (10.6%, a difference of 0.070%), Immigrants from Nicaragua (10.6%, a difference of 0.070%), and Immigrants from Morocco (10.6%, a difference of 0.12%).
| Demographics | Rating | Rank | Male Disability |
| Immigrants | Jordan | 98.4 /100 | #80 | Exceptional 10.6% |
| Immigrants | Chile | 98.3 /100 | #81 | Exceptional 10.6% |
| Immigrants | Guyana | 98.2 /100 | #82 | Exceptional 10.6% |
| Immigrants | Poland | 98.1 /100 | #83 | Exceptional 10.6% |
| Bulgarians | 98.1 /100 | #84 | Exceptional 10.6% |
| Sri Lankans | 97.9 /100 | #85 | Exceptional 10.6% |
| Immigrants | Ireland | 97.9 /100 | #86 | Exceptional 10.6% |
| Immigrants | Vietnam | 97.9 /100 | #87 | Exceptional 10.6% |
| Immigrants | Western Asia | 97.8 /100 | #88 | Exceptional 10.6% |
| Immigrants | Nicaragua | 97.8 /100 | #89 | Exceptional 10.6% |
| Immigrants | Morocco | 97.7 /100 | #90 | Exceptional 10.6% |
| Immigrants | France | 97.6 /100 | #91 | Exceptional 10.6% |
| Palestinians | 97.4 /100 | #92 | Exceptional 10.7% |
| Immigrants | St. Vincent and the Grenadines | 97.1 /100 | #93 | Exceptional 10.7% |
| Immigrants | Sweden | 96.9 /100 | #94 | Exceptional 10.7% |