Jordanian vs Immigrants from Belize Bachelor's Degree
COMPARE
Jordanian
Immigrants from Belize
Bachelor's Degree
Bachelor's Degree Comparison
Jordanians
Immigrants from Belize
41.2%
BACHELOR'S DEGREE
97.4/ 100
METRIC RATING
104th/ 347
METRIC RANK
32.1%
BACHELOR'S DEGREE
0.2/ 100
METRIC RATING
269th/ 347
METRIC RANK
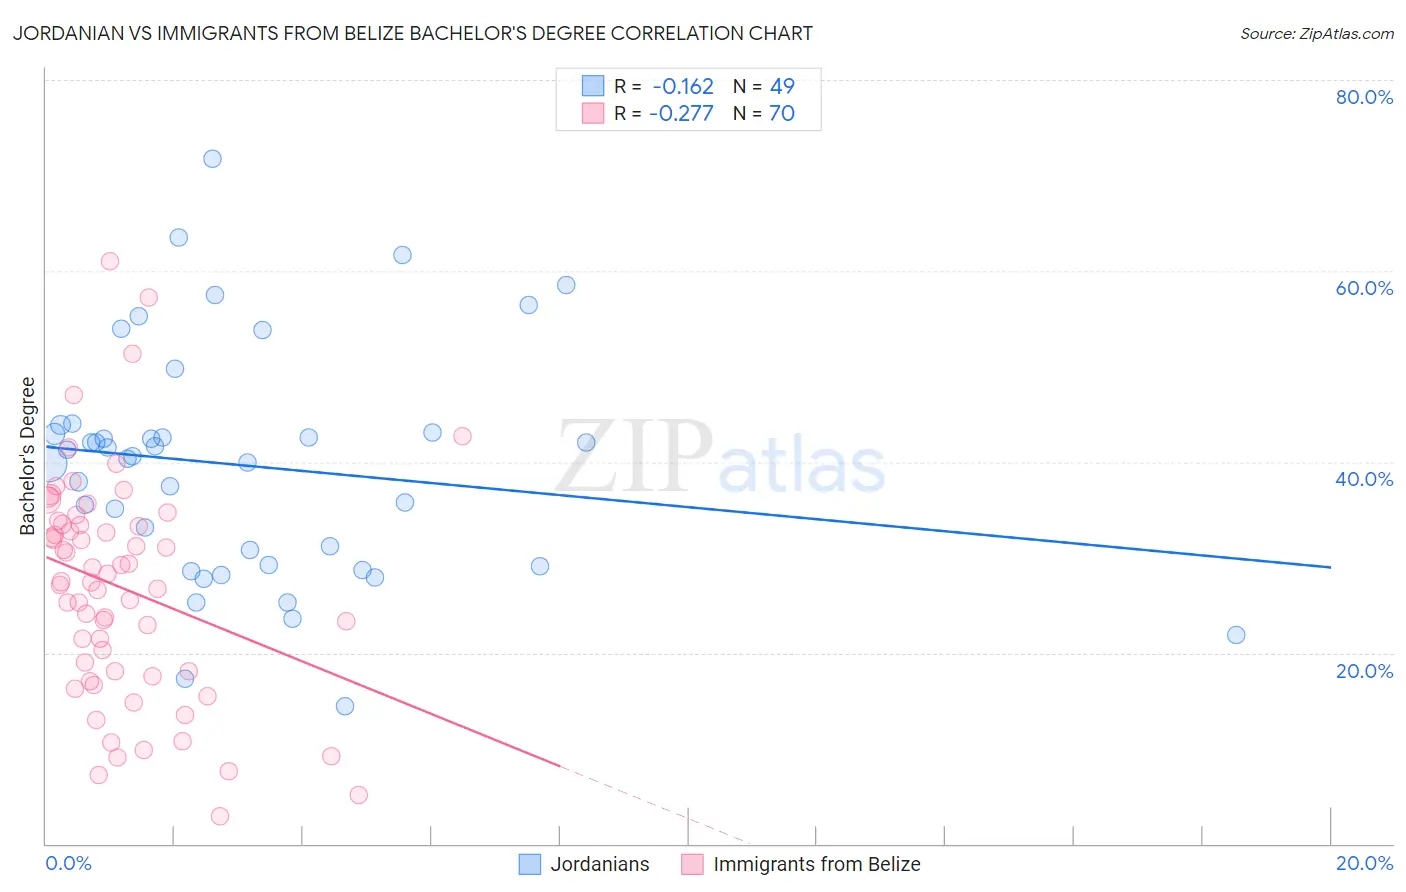
Jordanian vs Immigrants from Belize Bachelor's Degree Correlation Chart
The statistical analysis conducted on geographies consisting of 166,421,482 people shows a poor negative correlation between the proportion of Jordanians and percentage of population with at least bachelor's degree education in the United States with a correlation coefficient (R) of -0.162 and weighted average of 41.2%. Similarly, the statistical analysis conducted on geographies consisting of 130,322,630 people shows a weak negative correlation between the proportion of Immigrants from Belize and percentage of population with at least bachelor's degree education in the United States with a correlation coefficient (R) of -0.277 and weighted average of 32.1%, a difference of 28.2%.
Bachelor's Degree Correlation Summary
| Measurement | Jordanian | Immigrants from Belize |
| Minimum | 14.4% | 2.9% |
| Maximum | 71.8% | 61.0% |
| Range | 57.4% | 58.1% |
| Mean | 39.6% | 26.8% |
| Median | 40.5% | 27.4% |
| Interquartile 25% (IQ1) | 29.1% | 18.1% |
| Interquartile 75% (IQ3) | 43.4% | 33.5% |
| Interquartile Range (IQR) | 14.3% | 15.4% |
| Standard Deviation (Sample) | 12.2% | 11.8% |
| Standard Deviation (Population) | 12.1% | 11.7% |
Similar Demographics by Bachelor's Degree
Demographics Similar to Jordanians by Bachelor's Degree
In terms of bachelor's degree, the demographic groups most similar to Jordanians are Syrian (41.1%, a difference of 0.030%), Chilean (41.2%, a difference of 0.060%), Alsatian (41.0%, a difference of 0.29%), Immigrants from Italy (41.3%, a difference of 0.40%), and Northern European (41.0%, a difference of 0.46%).
| Demographics | Rating | Rank | Bachelor's Degree |
| Romanians | 98.4 /100 | #97 | Exceptional 41.6% |
| Immigrants | Ukraine | 98.3 /100 | #98 | Exceptional 41.5% |
| Immigrants | England | 98.1 /100 | #99 | Exceptional 41.4% |
| Macedonians | 98.1 /100 | #100 | Exceptional 41.4% |
| Immigrants | Morocco | 98.0 /100 | #101 | Exceptional 41.4% |
| Immigrants | Italy | 97.8 /100 | #102 | Exceptional 41.3% |
| Chileans | 97.5 /100 | #103 | Exceptional 41.2% |
| Jordanians | 97.4 /100 | #104 | Exceptional 41.2% |
| Syrians | 97.4 /100 | #105 | Exceptional 41.1% |
| Alsatians | 97.0 /100 | #106 | Exceptional 41.0% |
| Northern Europeans | 96.8 /100 | #107 | Exceptional 41.0% |
| Ukrainians | 96.6 /100 | #108 | Exceptional 40.9% |
| Arabs | 96.6 /100 | #109 | Exceptional 40.9% |
| Albanians | 96.5 /100 | #110 | Exceptional 40.9% |
| Immigrants | Chile | 96.4 /100 | #111 | Exceptional 40.8% |
Demographics Similar to Immigrants from Belize by Bachelor's Degree
In terms of bachelor's degree, the demographic groups most similar to Immigrants from Belize are Immigrants from Portugal (32.2%, a difference of 0.41%), Immigrants from Nicaragua (31.9%, a difference of 0.54%), Central American (31.9%, a difference of 0.63%), Comanche (31.9%, a difference of 0.66%), and American (31.9%, a difference of 0.78%).
| Demographics | Rating | Rank | Bachelor's Degree |
| Immigrants | Jamaica | 0.5 /100 | #262 | Tragic 32.9% |
| Belizeans | 0.4 /100 | #263 | Tragic 32.8% |
| Central American Indians | 0.3 /100 | #264 | Tragic 32.5% |
| Bahamians | 0.3 /100 | #265 | Tragic 32.5% |
| Immigrants | Dominica | 0.3 /100 | #266 | Tragic 32.5% |
| Cubans | 0.3 /100 | #267 | Tragic 32.5% |
| Immigrants | Portugal | 0.2 /100 | #268 | Tragic 32.2% |
| Immigrants | Belize | 0.2 /100 | #269 | Tragic 32.1% |
| Immigrants | Nicaragua | 0.2 /100 | #270 | Tragic 31.9% |
| Central Americans | 0.2 /100 | #271 | Tragic 31.9% |
| Comanche | 0.2 /100 | #272 | Tragic 31.9% |
| Americans | 0.2 /100 | #273 | Tragic 31.9% |
| Potawatomi | 0.2 /100 | #274 | Tragic 31.9% |
| Samoans | 0.1 /100 | #275 | Tragic 31.8% |
| Salvadorans | 0.1 /100 | #276 | Tragic 31.8% |