Jordanian vs Immigrants from West Indies College, 1 year or more
COMPARE
Jordanian
Immigrants from West Indies
College, 1 year or more
College, 1 year or more Comparison
Jordanians
Immigrants from West Indies
62.2%
COLLEGE, 1 YEAR OR MORE
97.2/ 100
METRIC RATING
97th/ 347
METRIC RANK
55.2%
COLLEGE, 1 YEAR OR MORE
0.5/ 100
METRIC RATING
256th/ 347
METRIC RANK
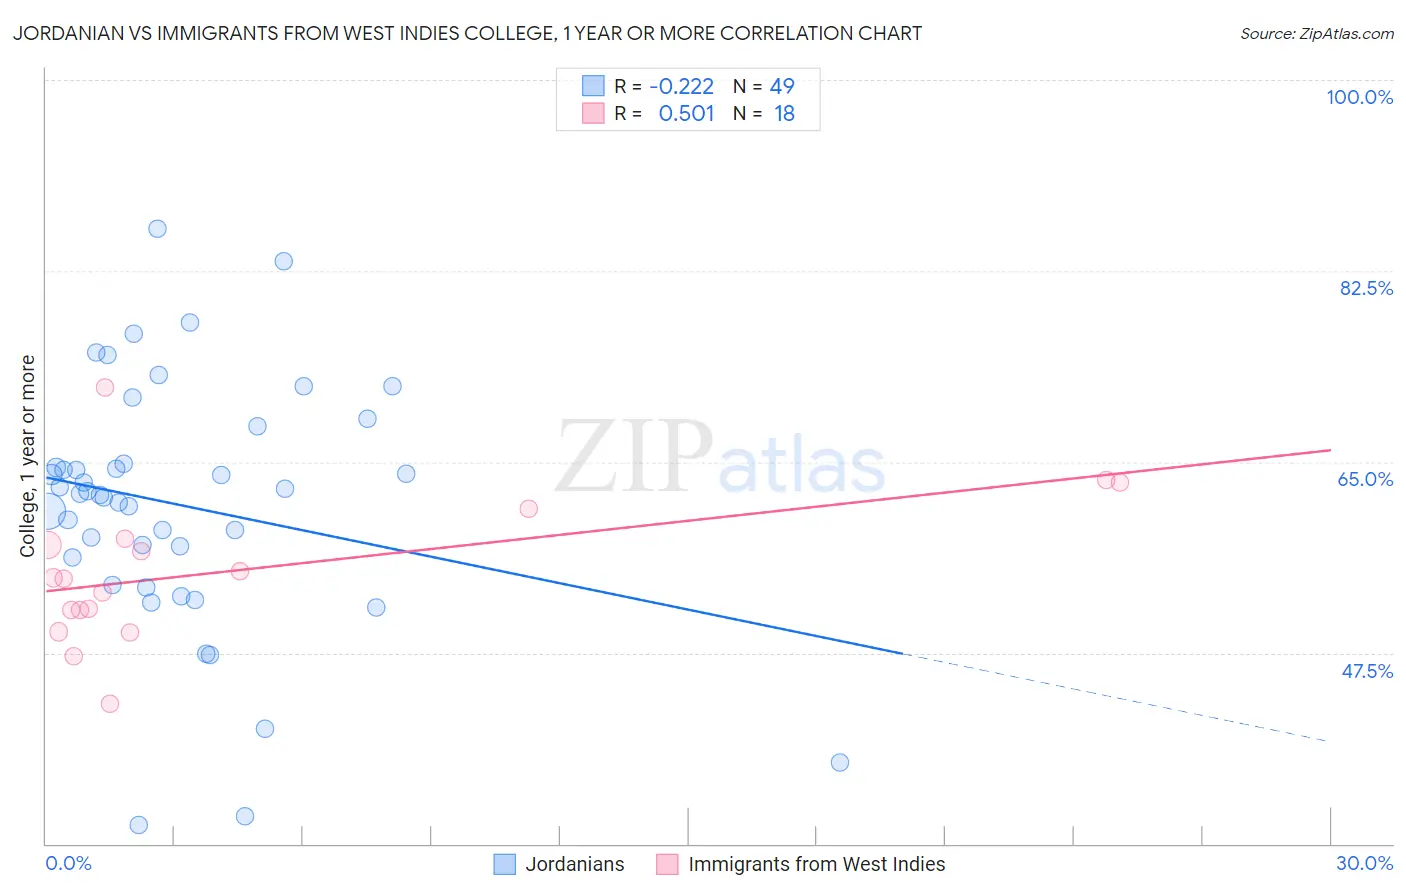
Jordanian vs Immigrants from West Indies College, 1 year or more Correlation Chart
The statistical analysis conducted on geographies consisting of 166,424,117 people shows a weak negative correlation between the proportion of Jordanians and percentage of population with at least college, 1 year or more education in the United States with a correlation coefficient (R) of -0.222 and weighted average of 62.2%. Similarly, the statistical analysis conducted on geographies consisting of 72,420,477 people shows a substantial positive correlation between the proportion of Immigrants from West Indies and percentage of population with at least college, 1 year or more education in the United States with a correlation coefficient (R) of 0.501 and weighted average of 55.2%, a difference of 12.7%.
College, 1 year or more Correlation Summary
| Measurement | Jordanian | Immigrants from West Indies |
| Minimum | 31.8% | 42.9% |
| Maximum | 86.4% | 71.8% |
| Range | 54.6% | 28.9% |
| Mean | 61.0% | 55.1% |
| Median | 62.1% | 54.3% |
| Interquartile 25% (IQ1) | 55.0% | 51.4% |
| Interquartile 75% (IQ3) | 66.5% | 58.0% |
| Interquartile Range (IQR) | 11.5% | 6.6% |
| Standard Deviation (Sample) | 11.4% | 6.8% |
| Standard Deviation (Population) | 11.3% | 6.6% |
Similar Demographics by College, 1 year or more
Demographics Similar to Jordanians by College, 1 year or more
In terms of college, 1 year or more, the demographic groups most similar to Jordanians are Carpatho Rusyn (62.2%, a difference of 0.0%), Chinese (62.2%, a difference of 0.010%), Croatian (62.2%, a difference of 0.010%), British (62.3%, a difference of 0.12%), and Icelander (62.1%, a difference of 0.17%).
| Demographics | Rating | Rank | College, 1 year or more |
| Immigrants | Western Asia | 97.9 /100 | #90 | Exceptional 62.5% |
| Immigrants | Eastern Europe | 97.8 /100 | #91 | Exceptional 62.4% |
| Immigrants | Egypt | 97.8 /100 | #92 | Exceptional 62.4% |
| Romanians | 97.7 /100 | #93 | Exceptional 62.4% |
| Immigrants | Croatia | 97.6 /100 | #94 | Exceptional 62.3% |
| British | 97.4 /100 | #95 | Exceptional 62.3% |
| Chinese | 97.2 /100 | #96 | Exceptional 62.2% |
| Jordanians | 97.2 /100 | #97 | Exceptional 62.2% |
| Carpatho Rusyns | 97.2 /100 | #98 | Exceptional 62.2% |
| Croatians | 97.1 /100 | #99 | Exceptional 62.2% |
| Icelanders | 96.8 /100 | #100 | Exceptional 62.1% |
| Swedes | 96.8 /100 | #101 | Exceptional 62.1% |
| Luxembourgers | 96.7 /100 | #102 | Exceptional 62.1% |
| Afghans | 96.4 /100 | #103 | Exceptional 62.0% |
| Chileans | 96.4 /100 | #104 | Exceptional 62.0% |
Demographics Similar to Immigrants from West Indies by College, 1 year or more
In terms of college, 1 year or more, the demographic groups most similar to Immigrants from West Indies are Immigrants from Bahamas (55.2%, a difference of 0.080%), Indonesian (55.1%, a difference of 0.10%), Japanese (55.2%, a difference of 0.12%), Immigrants from Barbados (55.4%, a difference of 0.38%), and African (55.0%, a difference of 0.38%).
| Demographics | Rating | Rank | College, 1 year or more |
| Immigrants | Trinidad and Tobago | 0.7 /100 | #249 | Tragic 55.5% |
| Delaware | 0.7 /100 | #250 | Tragic 55.5% |
| Immigrants | Cambodia | 0.6 /100 | #251 | Tragic 55.4% |
| Aleuts | 0.6 /100 | #252 | Tragic 55.4% |
| Immigrants | Barbados | 0.6 /100 | #253 | Tragic 55.4% |
| Japanese | 0.5 /100 | #254 | Tragic 55.2% |
| Immigrants | Bahamas | 0.5 /100 | #255 | Tragic 55.2% |
| Immigrants | West Indies | 0.5 /100 | #256 | Tragic 55.2% |
| Indonesians | 0.4 /100 | #257 | Tragic 55.1% |
| Africans | 0.4 /100 | #258 | Tragic 55.0% |
| Nepalese | 0.3 /100 | #259 | Tragic 54.9% |
| Jamaicans | 0.3 /100 | #260 | Tragic 54.9% |
| Ottawa | 0.3 /100 | #261 | Tragic 54.9% |
| Immigrants | St. Vincent and the Grenadines | 0.3 /100 | #262 | Tragic 54.8% |
| U.S. Virgin Islanders | 0.3 /100 | #263 | Tragic 54.8% |